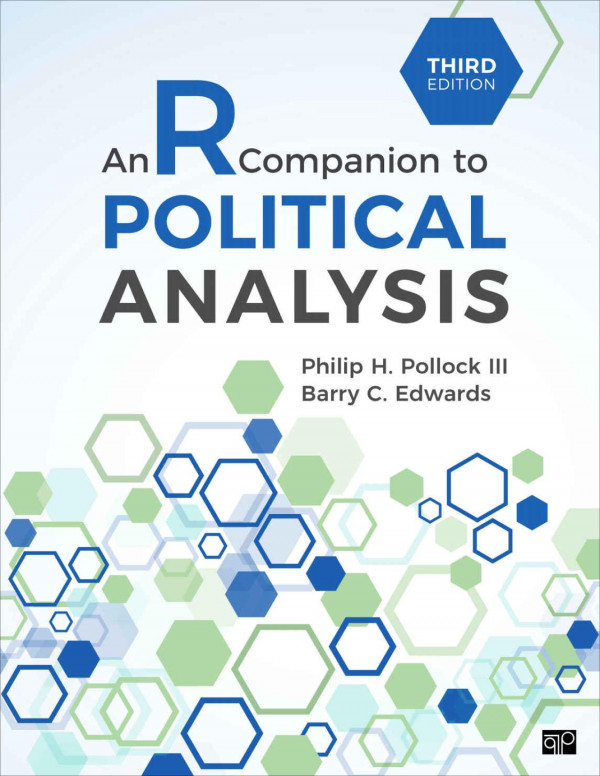
An R Companion to Political Analysis 3rd Edition by Philip Pollock, Barry Edwards 1071862413 9781071862414
$50.00 Original price was: $50.00.$25.00Current price is: $25.00.
An R Companion to Political Analysis 3rd Edition by Philip Pollock, Barry Edwards – Ebook PDF Instant Download/Delivery: 1071862413, 9781071862414
Full download An R Companion to Political Analysis 3rd Edition after payment

Product details:
ISBN 10: 1071862413
ISBN 13: 9781071862414
Author: Philip H Pollock, Barry C Edwards
The Third Edition of An R Companion to Political Analysis by Philip H. Pollock III and Barry C. Edwards teaches your students to conduct political research with R, the open-source programming language and software environment for statistical computing and graphics. This workbook offers the same easy-to-use and effective style as the other software companions to the Essentials of Political Analysis, tailored for R. With this comprehensive workbook, students analyze research-quality data to learn descriptive statistics, data transformations, bivariate analysis (such as cross-tabulations and mean comparisons), controlled comparisons, correlation and bivariate regression, interaction effects, and logistic regression. The clear explanations and instructions are aided by the use of many annotated and labeled screen shots, as well as QR codes linking to demonstration videos. The many end-of-chapter exercises allow students to apply their new skills. The Third Edition includes new and revised exercises, along with new and updated datasets from the 2020 American National Election Study, an experiment dataset, and two aggregate datasets, one on 50 U.S. states and one based on countries of the world. A new structure helps break up individual elements of political analysis for deeper explanation while an updated suite of R functions makes using R even easier. Students will gain valuable skills learning to analyze political data in R.
An R Companion to Political Analysis 3rd Table of contents:
I.1 About R
I.2 Installing R
I.3 A Quick Tour of the R Environment
I.4 Installing the “RCPA3” Package
• The Companion Datasets
I.5 Troubleshooting Installation Problems
I.6 Installing R Studio
I.7 Instant Access to Tutorials and Resources
Chapter 1 • Using R for Data Analysis
1.1 Interacting with R
1.2 Objects
1.2.1 Examples of Objects
1.2.2 Creating Objects
• A Closer Look: R Environments
1.2.3 Accessing Some of an Object’s Values
1.3 Functions
1.3.1 Using a Function’s Arguments
1.3.2 The Widget Factory Needs Your Help!
1.4 Writing and Running Scripts
1.5 Managing R Output: Graphics and Text
1.6 Getting Help
Chapter 1 Exercises
Chapter 2 • Descriptive Statistics
2.1 Identifying Levels of Measurement
2.2 Describing Nominal Variables
2.2.1 Generating Tables of Descriptive Statistics
2.2.2 Using Tables and Figures to Describe Distributions of Values
2.3 Describing Ordinal Variables
2.3.1 Describing Two Variables in One Table
2.3.2 Assessing the Dispersion of Ordinal Variables
• A Closer Look: Weighted and Unweighted Analysis: What’s the Difference?
2.4 Describing Interval-Level Variables
2.4.1 Using Statistics to Describe Interval Variables
• A Closer Look: Additional Math and Statistics Functions
2.4.2 Visualizing Dispersion with Histograms
• A Closer Look: Editing Plots with Purpose
2.5 Obtaining Case-Level Information
Chapter 2 Exercises
Chapter 3 • Creating and Transforming Variables
3.1 Applying Mathematical and Logical Operators to Variables
3.1.1 Mathematical Operators
3.1.2 Logical Operators
3.2 Creating Dummy Variables
3.3 Adding or Modifying Variable Attributes
3.3.1 Labels
3.3.2 Class Attributes
3.3.3 Levels of a Variable’s Values
3.4 Collapsing Variables into Simplified Categories
3.5 Centering, Standardizing, and Ranking Numeric Variables
3.6 Creating an Additive Index
Chapter 3 Exercises
Chapter 4 • Making Comparisons
• Analysis Guide
4.1 Creating Cross-Tabulations to Make Comparisons
• A Closer Look: Debugging R Code
4.2 Mean Comparison Analysis
4.3 Making Comparisons with Interval-Level Independent Variables
• A Closer Look: Creating Plots from Summary Data
Chapter 4 Exercises
Chapter 5 • Graphing Relationships and Describing Patterns
5.1 Graphs for Binary Dependent Variables
5.1.1 Simple Bar Charts with Nominal-Level Independent Variables
5.1.2 Simple Line Plots with Ordinal-Level Independent Variables
5.1.3 Graphs with Interval-Level Independent Variables
5.2 Graphs for Nominal Dependent Variables
5.2.1 Clustered Bar Charts with Nominal Independent Variables
5.2.2 Multiple Line Plots with Ordinal Independent Variables
5.2.3 Graphs with Interval-Level Independent Variables
5.3 Graphs for Ordinal-Level Dependent Variables
5.3.1 Using Bars or Lines to Represent Select Values
5.3.2 Mosaic Plots for an Ordinal–Ordinal Relationship
5.3.3 Graphs with Interval-Level Independent Variables
5.4 Graphs for Interval-Level Dependent Variables
5.4.1 Plotting Means with Bars or Lines
5.4.2 Box Plots
5.4.3 Scatterplots
• A Closer Look: Creating Custom Graphs with R
Chapter 5 Exercises
Chapter 6 • Random Assignment and Sampling
6.1 Random Assignment
6.1.1 Two Groups with Equal Probability
6.1.2 Multiple Groups with Varying Probabilities
6.2 Analyzing the Results of an Experiment
6.2.1 Assessing Random Assignment
6.2.2 Evaluating the Effect of Treatment
6.3 Random Sampling
6.3.1 Simple Random Samples with Replacement
6.3.2 Simple Random Samples without Replacement
6.3.3 Systematic Random Samples
6.3.4 Clustered and Stratified Random Samples
6.4 Selecting Cases for Qualitative Analysis
6.4.1 Most Similar Systems
6.4.2 Most Different Systems
6.5 Analyzing Data Ethically: Clarity, Replication, and Transparency
6.5.1 Ethical Issues in Data Analysis
6.5.2 Ten Tips for Writing R Scripts
Chapter 6 Exercises
Chapter 7 • Making Controlled Comparisons
7.1 Cross-Tabulation Analysis with Control Variables
7.1.1 Start with a Basic Cross-Tabulation
7.1.2 Adding Control Variables
7.1.3 Interpreting Controlled Cross-Tabulations
7.1.4 Options for Graphing Controlled Cross-Tabulations
• A Closer Look: The Legend Function
7.2 Mean Comparison Analysis with Control Variables
7.2.1 Start with a Basic Mean Comparison Table
7.2.2 Adding Control Variables
7.2.3 Interpreting a Controlled Mean Comparison
7.2.4 Options for Graphing Controlled Mean Comparisons
7.3 Controlled Comparisons with Interval-Level Control Variables
Chapter 7 Exercises
Chapter 8 • Foundations of Statistical Inference
8.1 Estimating a Population Proportion with R Simulation
8.2 Estimating a Population Mean with R Simulation
• A Closer Look: Using Probability Distributions to Simulate Raw Data
8.3 Expected Shape of Sampling Distributions
8.3.1 Central Limit Theorem and the Normal Distribution
8.3.2 Normal Distribution of Sample Proportions
8.3.3 Normal Distribution of Sample Means
8.3.4 The Standard Normal Distribution
8.3.5 The Empirical Rule (68-95-99 Rule)
8.4 Confidence Intervals and Margins of Error
8.4.1 Critical Values for Confidence Intervals
8.4.2 Reporting the Confidence Interval for a Sample Proportion
8.4.3 Reporting the Confidence Interval for a Sample Mean
8.5 Student’s t-Distribution: When You’re Not Completely Normal
8.5.1 The t-Distribution’s Role in Inferential Statistics
8.5.2 Critical Values of t-Distributions
Chapter 8 Exercises
Chapter 9 • Hypothesis Tests with One or Two Samples
9.1 Role of the Null Hypothesis
9.2 Testing a Hypothesis about One Sample Proportion
9.3 Testing the Difference between Two Sample Proportions
9.3.1 Testing the Difference of Proportions with z Scores and P-Values
9.3.2 Confidence Interval for the Difference of Proportions
• A Closer Look: Changing the Order of Groups 1 and 2
9.3.3 Comparing Two Similarly Coded Variables (x1 vs. x2)
9.4 Testing a Hypothesis about One Sample Mean
• A Closer Look: Treating Census as a Sample
9.5 Testing the Difference between Two Sample Means
9.5.1 Variants of the Difference of Means Test
9.5.2 Testing the Difference of Means with the testmeansC Function
9.5.3 Confidence Intervals for the Difference of Means
9.5.4 Testing the Difference of Means Assuming Equal Variances
9.5.5 Testing the Difference of Means with Two Similarly Coded Variables
9.5.6 Paired Difference of Means Test
Chapter 9 Exercises
Chapter 10 • Chi-Square Test and Analysis of Variance
10.1 The Chi-Square Test of Independence
10.1.1 How the Chi-Square Test Works
10.1.2 Conducting a Chi-Square Test
10.1.3 Example with a Nominal Independent Variable
10.1.4 R’s Chi-Square Distribution Functions
• A Closer Look: Other Applications of Chi-Square Tests
10.2 Measuring the Strength of Association between Categorical Variables
10.2.1 Lambda
10.2.2 Somers’ d
10.2.3 Cramer’s V
10.3 Chi-Square Test and Measures of Association in Controlled Comparisons
10.3.1 Analyzing an Ordinal-Level Relationship with a Control Variable
10.3.2 Analyzing a Nominal-Level Relationship with a Control Variable
10.4 Analysis of Variance
10.4.1 How ANOVA Works
10.4.2 Single-Factor ANOVA
10.4.3 Two-Factor ANOVA
10.4.4 R’s F-Distribution Functions
Chapter 10 Exercises
Chapter 11 • Correlation and Bivariate Regression
11.1 Correlation Analysis
11.1.1 Correlation between Two Variables
11.1.2 Correlation among More Than Two Variables
• A Closer Look: Other Types of Applications of Correlation Analysis
11.2 Bivariate Regression Analysis
11.2.1 Are Democratic Countries More Peaceful?
• A Closer Look: R-Squared and Adjusted R-Squared: What’s the Difference?
11.2.2 Turnout in Battleground States Example
11.2.3 Using Regression Results to Make Informed Predictions
11.3 Visualizing Bivariate Regression Analysis
11.3.1 Scatterplots with Regression Lines
11.3.2 Visualizing Regression Analysis with Categorical Independent Variables
11.3.3 Alternatives to the Plot Function
• A Closer Look: What If a Scatterplot Doesn’t Show a Linear Relationship?
11.4 Regression Analysis with Weighted Observations
• A Closer Look: Creating Tables of Regression Results
Chapter 11 Exercises
Chapter 12 • Multiple Regression
12.1 Estimating a Multiple Regression Model
12.1.1 Voter Turnout Revisited
12.1.2 Another Look at Democratic Peace
12.2 Regression with Multiple Dummy Variables
12.2.1 Estimating a Regression Model with Multiple Dummy Variables
12.2.2 Interpreting Regression Results with Multiple Dummy Variables
• A Closer Look: Changing the Reference Category
12.2.3 Visualizing Regression Analysis with Multiple Dummy Variables
12.3 Interaction Effects in Multiple Regression
12.3.1 Regression Equation with an Interaction Term
12.3.2 Estimating and Interpreting a Linear Model with an Interaction Term
12.3.3 Visualizing Interactive Relationships
12.4 Visualizing Multiple Regression Analysis
12.4.1 One Categorical and One Interval Independent Variable
12.4.2 Visualizing Regression with Two Interval Independent Variables
12.4.3 Visualizing Regression with Two Categorical Independent Variables
• A Closer Look: Visualizing Multiple Regression with Many Independent Variables
Chapter 12 Exercises
Chapter 13 • Analyzing Regression Residuals
13.1 Expected Values, Observed Values, and Regression Residuals
13.1.1 Example from Bivariate Regression Analysis
13.1.2 Residuals from Multiple Regression Analysis
13.2 Squared and Standardized Residuals
13.2.1 Squared Residuals
13.2.2 Standardized Residuals
13.3 Assumptions about Regression Residuals
13.4 Analyzing Graphs of Regression Residuals
13.4.1 Histogram of Regression Residuals
13.4.2 Residual Diagnostic Plots
13.5 Testing Regression Assumptions with Residuals
13.5.1 Testing the Assumption That Residuals Are Normally Distributed
13.5.2 Testing the Constant Variance Assumption
13.5.3 Regression Diagnostics for Multiple Regression Analysis
• A Closer Look: Other Regression Diagnostic Tests
13.6 What If You Diagnose Problems with Residuals?
Chapter 13 Exercises
Chapter 14 • Logistic Regression
14.1 Odds, Logged Odds, and Probabilities
14.2 Estimating Logistic Regression Models
14.2.1 Logistic Regression with One Independent Variable
14.2.2 Reporting and Interpreting Odds Ratios
14.2.3 Evaluating Model Fit
14.3 Logistic Regression with Multiple Independent Variables
14.3.1 Estimating Model with Multiple Independent Variables
14.3.2 Odds Ratios and Model Fit Statistics
14.3.3 Logistic Regression Analysis with Weighted Observations
14.4 Plotting Predicted Probabilities with One Independent Variable
14.4.1 Interval-Level Independent Variables
14.4.2 Categorical Independent Variables
• A Closer Look: Marginal Effects and Expected Changes in Probability
14.5 Plotting Predicted Probabilities with Multiple Independent Variables
14.5.1 One Categorical and One Interval-Level Independent Variable
14.5.2 Multiple Categorical Independent Variables
14.5.3 Two Interval-Level Independent Variables
14.5.4 Plotting Predicted Probabilities with Many Independent Variables
Chapter 14 Exercises
Chapter 15 • Doing Your Own Political Analysis
15.1 Doable Research Ideas
15.1.1 Political Knowledge and Interest
15.1.2 Self-Interest and Policy Preferences
15.1.3 Economic Performance and Electronic Outcomes
15.1.4 Electoral Turnout in Comparative Perspective
15.1.5 Correlates of State Policies
15.1.6 Religion and Politics
15.1.7 Race and Politics
15.2 Reading R-Format Datasets
15.3 Importing Data into R
15.3.1 SPSS- and Stata-Formatted Datasets
15.3.2 Microsoft Excel Datasets
15.3.3 Data from HTML Tables
15.4 Writing It Up
15.4.1 The Research Question
15.4.2 Previous Research
15.4.3 Data, Hypotheses, and Analysis
15.4.4 Conclusions and Implications
Chapter 15 Exercises
Appendix, Table A-1: Variables in the Debate Experiment Dataset
Appendix, Table A-2: Variables in the NES Dataset
Appendix, Table A-3: Variables in the States Dataset by Topic
Appendix, Table A-4: Variables in the World Dataset by Topic
People also search for An R Companion to Political Analysis 3rd:
an r companion to political analysis answer key
an r companion to political analysis pdf
an r companion to political analysis
an r companion to political analysis exercise answers
Tags:
Philip Pollock,Barry Edwards,Companion,Political
You may also like…
Computers - Programming
Mathematics - Applied Mathematics
An Introduction to Functional Analysis 1st Edition by James C. Robinson 9781108771580 1108771580
Mathematics - Analysis
An Introduction to Infinite Products 1st Edition Charles H. C. Little
Jurisprudence & Law - Tort & Liability Law
Politics & Philosophy - Social Sciences
Science (General)
Mathematics - Analysis
An Introduction to Analysis 1st Edition by Robert C Gunning ISBN 0691178798 9780691178790
Uncategorized
Uncategorized


