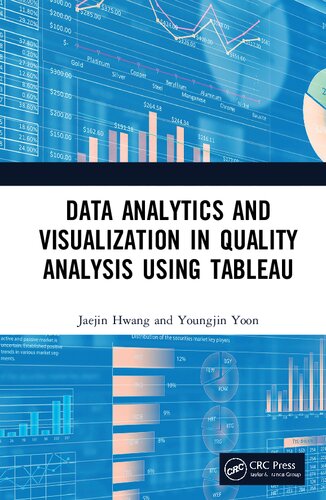
Data Analytics and Visualization in Quality Analysis using Tableau 1st Edition by Jaejin Hwang, Youngjin Yoon ISBN 0367744147 9780367744144
$50.00 Original price was: $50.00.$25.00Current price is: $25.00.
Data Analytics and Visualization in Quality Analysis using Tableau 1st Edition by Jaejin Hwang, Youngjin Yoon – Ebook PDF Instant Download/Delivery: 0367744147 ,9780367744144
Full download Data Analytics and Visualization in Quality Analysis using Tableau 1st Edition after payment

Product details:
ISBN 10: 0367744147
ISBN 13: 9780367744144
Author: Jaejin Hwang, Youngjin Yoon
Data Analytics and Visualization in Quality Analysis using Tableau 1st Edition Table of contents:
Chapter 1 Introduction
Chapter Overview and Expected Learning Outcomes
1.1 Basic Concepts in Quality Analysis
1.2 What Is Tableau?
1.3 How to Leverage Tableau in Quality Analysis
Chapter 2 Basic Quality Tools with Tableau
Chapter Overview and Expected Learning Outcomes
What Is the Chart?
Tableau Categorizing Fields
2.1 Stacked Bar Chart
2.1.1 Introduction of Stacked Bar Chart
2.1.2 Tableau Example
2.2 Histogram
2.2.1 Introduction of Histogram
2.2.2 Tableau Example
2.3 Butterfly Chart
2.3.1 Introduction of Butterfly Chart
2.3.2 Tableau Example
2.4 Donut Chart
2.4.1 Introduction of Donut Chart
2.4.2 Tableau Example
2.5 Scatter Plot
2.5.1 Introduction of Scatter Plot
2.5.2 Tableau Example
2.6 Bubble Chart
2.6.1 Introduction of Bubble Chart
2.6.2 Tableau Example
2.7 Box Plot
2.7.1 Introduction of Box Plot
2.7.2 Tableau Example
2.8 Pareto Chart
2.8.1 Introduction of Pareto Chart
2.8.2 Tableau Example
2.9 Bump Chart
2.9.1 Introduction of Bump Chart
2.9.2 Tableau Example
2.10 Maps
2.10.1 Introduction of Maps
2.10.2 Tableau Example
2.11 Gantt Chart
2.11.1 Introduction of Gantt chart
2.11.2 Tableau Example
2.12 Control Chart for Variables
2.12.1 Introduction of Control Chart for Variables
2.12.2 Tableau Example
2.12.3 R Chart
2.12.4 X-bar Chart
2.13 Control Chart for Attributes
2.13.1 Introduction of Control Chart for Attributes
2.13.2 Tableau Example
Chapter 3 Quality Dashboard
Chapter Overview and Expected Learning Outcomes
3.1 What Is a Dashboard?
3.2 Dashboard Type
3.3 Dashboard Design Approach
3.4 Healthcare Quality Dashboard
3.5 Airline Quality Dashboard
3.6 Manufacturing Quality Dashboard
3.7 Warehouse Quality Dashboard
Chapter 4 Case Studies
Chapter Overview and Expected Learning Outcomes
4.1 Case Studies and Data Storytelling
4.1.1 Goal
4.1.2 Audience
4.1.3 Message
4.1.4 Engagement
4.2 Red Wine Quality (Case 1)
4.2.1 Introduction of Dataset
4.2.2 Tableau Example
4.3 Airline Passenger Satisfaction (Case 2)
4.3.1 Introduction of Dataset
4.3.2 Tableau Example
4.4 Driverless Car Failure (Case 3)
4.4.1 Introduction of Dataset
4.4.2 Tableau Example
4.5 Real Time Voice Call Quality Data from Customers (Case 4)
4.5.1 Introduction of Dataset
4.5.2 Tableau Example
4.6 Brewery Production (Case 5)
4.6.1 Introduction of Dataset
4.6.2 Tableau Example
4.7 Seoul Bike Sharing Demand (Case 6)
4.7.1 Introduction of Dataset
4.7.2 Tableau Example
Index
People also search for Data Analytics and Visualization in Quality Analysis using Tableau 1st Edition:
data analytics vs analysis
data analytics and quality assurance
data quality and analytics
data analytics and visualization in health care
data analytics in quality control
You may also like…
Computers - Databases
Uncategorized
Biology and other natural sciences
Computers - Databases
Computers - Databases
Data Storytelling and Visualization with Tableau: A Hands-on Approach 1st Edition Prachi Manoj Joshi
Computers - Programming


