Displaying Time Series Spatial and Space Time Data with R 2nd Edition by Oscar Perpinan Lamigueiro ISBN 9781138089976 1138089974
$50.00 Original price was: $50.00.$25.00Current price is: $25.00.
Displaying Time Series Spatial and Space Time Data with R 2nd Edition by Oscar Perpinan Lamigueiro – Ebook PDF Instant Download/Delivery: 9781138089976 ,1138089974
Full download Displaying Time Series Spatial and Space Time Data with R 2nd Edition after payment
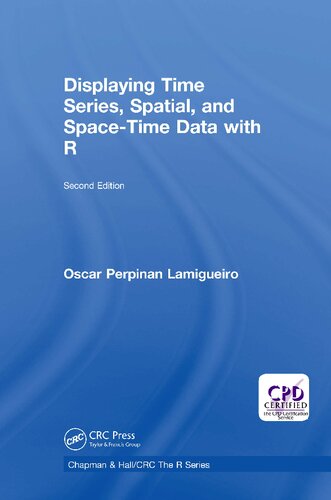
Product details:
ISBN 10: 1138089974
ISBN 13: 9781138089976
Author: Oscar Perpinan Lamigueiro
Displaying Time Series Spatial and Space Time Data with R 2nd Edition Table of contents:
1 Introduction
1.1 What This Book Is About
1.2 What You Will Not Find in This Book
1.3 How to Read This Book
1.4 R Graphics
1.5 Packages
1.6 Software Used to Write This Book
1.7 About the Author
1.8 Acknowledgments
I Time Series
2 Displaying Time Series: Introduction
2.1 Packages
2.2 Further Reading
3 Time on the Horizontal Axis
3.1 Time Graph of Variables with Different Scales
3.2 Time Series of Variables with the Same Scale
3.3 Stacked Graphs
3.4 Interactive Graphics
4 Time as a Conditioning or Grouping Variable
4.1 Scatterplot Matrix: Time as a Grouping Variable
4.2 Scatterplot with Time as a Conditioning Variable
5 Time as a Complementary Variable
5.1 Polylines
5.2 A Panel for Each Year
5.3 Interactive Graphics: Animation
6 About the Data
6.1 Siar
6.2 Unemployment in the United States
6.3 Gross National Income and Emissions
II Spatial Data
7 Displaying Spatial Data: Introduction
7.1 Packages
7.2 Further Reading
8 Thematic Maps: Proportional Symbol Mapping
8.1 Introduction
8.2 Proportional Symbol Mapping with spplot
8.3 Proportional Symbol Mapping with ggplot
8.4 Optimal Classification to Improve Discrimination
8.5 Spatial Context with Underlying Layers and Labels
8.6 Spatial Interpolation
8.7 Interactive Graphics
9 Thematic Maps: Choropleth Maps
9.1 Introduction
9.2 Quantitative Variable
9.3 Qualitative Variable
9.4 Small Multiples with Choropleth Maps
9.5 Bivariate Map
9.6 Interactive Graphics
10 Thematic Maps: Raster Maps
10.1 Quantitative Data
10.2 Categorical Data
10.3 Bivariate Legend
10.4 Interactive Graphics
11 Vector Fields
11.1 Introduction
11.2 Arrow Plot
11.3 Streamlines
12 Physical and Reference Maps
12.1 Physical Maps
12.2 Reference maps
13 About the Data
13.1 Air Quality in Madrid
13.2 Spanish General Elections
13.3 CM SAF
13.4 Land Cover and Population Rasters
III Space-Time Data
14 Displaying Spatiotemporal Data: Introduction
14.1 Packages
14.2 Further Reading
15 Spatiotemporal Raster Data
15.1 Introduction
15.2 Level Plots
15.3 Graphical Exploratory Data Analysis
15.4 Space-Time and Time Series Plots
16 Spatiotemporal Point Observations
16.1 Introduction
16.2 Graphics with spacetime
17 Animation
17.1 Depicting Variable Changes Over Time: Raster Data
17.2 Depicting Variable Changes Over Time: Point Space-Time Data
17.3 Fly-by Animation
IV Glossary, Bibliography and Index
Bibliography
Index
People also search for Displaying Time Series Spatial and Space Time Data with R 2nd Edition:
time series spatial data
spatial series data
zoo time series in r
unevenly spaced time series r
tsdisplay r package
Tags: Oscar Perpinan Lamigueiro, Time Series Spatial, Space Time Data, R
You may also like…
Mathematics - Applied Mathematics
Computers - Artificial Intelligence (AI)
Computers - Computer Science
Romance - Paranormal Romance
Queen of Time and Thunder Complete Series The Queen of Time and Thunder 1 4 1st Edition Sadie Anders
Mathematics - Mathematical Statistics
Computers - Artificial Intelligence (AI)
Computers - Databases
Uncategorized

