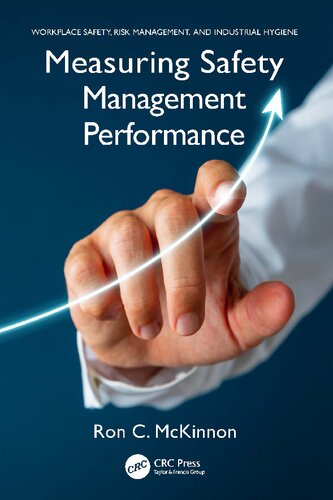
Measuring Safety Management Performance 1st Edition by Ron 9781000998702 1000998703
$50.00 Original price was: $50.00.$25.00Current price is: $25.00.
Measuring Safety Management Performance 1st Edition Ron C. Mckinnon – Ebook Instant Download/Delivery ISBN(s): 9781000998702, 1000998703
Product details:
- ISBN 10:1000998703
- ISBN 13:9781000998702
- Author: Ron
Measuring Safety Management Performance
Table contents:
Part I Introduction to Safety Management
Chapter 1 Safety Management
Introduction
Consequence-Based Measurements
Not an Accurate Indicator
Traditional Measurement
False Sense of Security
Safety Performance
No Control
Shifting the Paradigm
Conclusion
Summary
Chapter 2 Workplace Health and Safety
Workplace Injury and Death Statistics
Safety
Safety Is a State
A Safety Measure
Occupational Hygiene
Objective
Occupational Hygiene Stresses
Hazard
Potential Hazard
Risk
Hazard Identification and Risk Assessment (HIRA)
Risk Assessment
Components
Hierarchy of Control
Business Interruption
Accident
Other Definitions
Near Miss Incident
Accident/Injury/Incident Confusion
Clarity
Injury, Disease, or Illness
High-Risk Behavior (Unsafe Act)
High-Risk Condition (Unsafe Condition)
Immediate Accident Causes?
Accident Sequence or Loss Causation Sequence (Domino Sequence)
Accident Causation Theories
Loss and No Loss
A Basic Loss Causation Sequence
Shift in Time or Position
Narrowly Avoided
H.W. Heinrich
Losses
Types of Losses
Direct Losses (Insured Losses)
Medical
Compensation
Permanent Disability
Rehabilitation
Health and Safety Management System (SMS)
A Continuous Process
Risk-based, Management-Led, and Audit-driven
Risk-based
Management-led
Audit-driven
Management Safety Functions
Safety Controlling
Risk-based, Management-led, Audit-driven SMS
Authority, Responsibility, and Accountability
Summary
Chapter 3 Understanding and Analyzing Accidental Loss Causation
A Sequence of Events
Other Accident Causation Theories
Loss Causation Sequence
Losses
Importance
Near Miss Incident
Traditional Viewpoint
Failure to Identify Hazards and Assess the Risk
Weak or Non-Existent Safety Management System
Accident Root Causes
High-Risk (Unsafe) Conditions and High-Risk (Unsafe) Behaviors
High-Risk (Unsafe) Conditions
High-Risk (Unsafe) Behavior
Exposure, Impact, or Energy Exchange
Illness, Injury, Property Damage, and Business Interruption
Cost of Accidental Loss
Safety Management System (SMS)
Summary
Chapter 4 Defining Safety Management Performance
Safety Management
Performance
Safety Management Performance
Safety Management Performance Measurements
A Complex Challenge
Types of Safety Management Performance Measurement Indicators
Leading Measurements
Lagging Measurements
Soft Measures
Hard Measurements
Why Measure Safety Management Performance?
Benefits of Safety Management Performance Measurement
Safety Effort and Experience (SEE)
Appropriate Mix of Measures
Focus
Management Review
Against Standards and Objectives
Internal Measurements
External Measurements
What Gets Measured, Gets Done
Safety Is a State
Too Simplistic
If It Cannot Be Measured, It Will Not Be Done
Risk Profile
Risk Free
Alarp
Input Measurements (Positive Performance Indicators)
Process Measurements
Output Measurements
Characteristics of Good Safety Management Performance Measurement Indicators
The Safety Record
Public Perception
Differing Rules
Safety Fear Factor
World Safety Record
Safety Verses Injury
Paradigm
Summary
Part II Safety Management Performance Measurements
Chapter 5 Pre-Contact, Contact, and Post-Contact Measurement
Pre-Contact, Contact, and Post-Contact Control
Pre-Contact Phase Control
Positive Performance Indicators (PPIs)
Pre-Contact Control
Pre-Contact Phase – Safety Performance Measurements (Leading Indicators)
Scoring Method
Minimum Standard Detail
Measuring the Hazard Burden
Contact Phase of the Accident
Contact Phase Control
Contact Phase – Safety Performance Measurements
Trends
Types of Energy Exchange
Accident and Near Miss Incident
Case Study
Post-Contact Phase
Post-Contact Phase Measurement
System Failure
Accident-Based Metrics
Summary
Part III Measuring Lagging Indicators of Safety Management Performance
Chapter 6 Lagging Indicators of Safety Performance: Injuries, Illness, and Diseases
Introduction
Measures of Failure
Measures of Consequence
Rear-View Mirror
After the Event
Consequences
Outcomes
Advantages of Injury and Illness Data
Disadvantages
Measurement of Control
Guidelines to Recording Injury Experience
Employment
Occupational Injury
Occupational Fatality
Occupational Fatality Rates
Historic Measure
Golden Gate Bridge
Hoover Dam
High-Rise Construction Fatalities
Deadliest Project
World Cup 2022 Qatar
Fatality-free Shifts
Lost Time Injury
Temporary Total Disability (Lost Time Injury)
Shift Lost
Regular Job
The Acid Test
Injury Frequency Rates
Universally Used
History
Comparison
National Figures
Legal Rating
Lost Time Injury Frequency Rate (LTIFR) or Disabling Injury Frequency Rate (DIFR)
Injury Incidence Rates
Lost Time Injury Incidence Rates (LTIIR) or Disabling Injury Incidence Rate (DIIR)
Total Injury Rate
The Total Recordable Disease Frequency Rate
OSHA Recordable Injury or Illness
DART
The Total Case Incident Rate
Mine Safety and Health Administration (MSHA) Reportable Injury
MSHA Incidence Rates
RIDDOR (Reporting of Injuries, Diseases and Dangerous Occurrences)
Injury Severity Rates
Workdays Lost Due to Work-related Accidents
Average Days Charged per Disabling Injury
Disabling Injury Index
First Aid Defined
Medical Treatment Defined
First Aid Injury Rate
Minor Injury Rate
Target Injury Frequency Rate (TIFR)
Analysis of High-Risk Behavior and High-Risk Workplace Conditions
Exposure, Impact or Energy Exchange, Terminology
Energy Transfer (Exchange) Types
Top three Causes
Agency
Two Types of Agencies
Agency Part
Agency Trends
Analysis of Body Part Injured
Other Safety Performance Metrics
Road Safety Performance Measurements
Fatal and Severe Injuries
Aircraft Accidents
Costs of Injuries and Illnesses
Conclusion
Summary
Chapter 7 Underreporting of Injuries, Illnesses, and Damage
Manipulation of Injury Definitions
Creative Bookkeeping
Underreporting of Injuries
United States Government Accountability Office
Hidden Tragedy
The Safety Fear Factor
Imbedded Culture
Injured Workers Under Pressure
International Culture
No Blood – No Foul
Near Miss Incidents
Reporting Property Damage Accidents
Safe Space
Safety Bribery
Injury-Free Bonuses
The Root of Evil
Safety Incentive Schemes
Safety Awards
Injury-Free Periods
False Impression
Based on Actions
Safety Gimmicks
Safety Publicity Boards
Incorrect Terminology
Evil Record
Zero Harm
A Goal
An Objective
Strategy Must Be Defined
The Health and Safety Management System (SMS)
Campaigns
Paper Cut Injury?
Conclusion
Summary
Chapter 8 Awards Based on Lagging Indicators
The National Occupational Safety Association (NOSA)
Collection of Injury Statistics
NOSA Award Plan
National Safety Council (US) Awards
Superior Safety Performance Award
Significant Improvement Award
Perfect Record Award
The Million Workhours Award
Mining Awards
The NOSA 5-Star Safety and Health Management System
Star Grading Awards
Safety Effort and Experience
Occupational Safety and Health Administration (OSHA) Voluntary Protection Program (VPP)
The VPP Star Program
Summary
Chapter 9 Lagging Indicators of Safety Performance: Damage, Fires, and Interruption
Accident Outcomes
Unintended Events
Bridging the Gap
Accidental Property Damage
Accident Ratios
Accident Ratio Study
Other Ratios Researched
Criticism of Accident Ratios
Investigation and Recording
Risk Matrix
Calculating the Accident Ratio
Barriers to Reporting of Downgrading Events
Amnesty
Vital Statistics
Calculating an Accident Ratio
Costing
Measuring Property Damage Accidents
Fire Damage Accidents
Environmental Harm
Exxon Valdez Oil Spill
Other Major Accidents
Totally Hidden Costs
Summary
Chapter 10 Cause of Injury or Damage: Transfer of Energy
Impact, Exposure, or Energy Transfer Types
Energy Release Theory
Energy Exchange – Not Accident Types
Energy Transfer Analysis
Agency
Agency Part
Contact Control
Summary
Chapter 11 Total Cost of Risk
Accident Costs
Increased Premiums
The Experience Modification Rate (EMR)
Incidental Costs
Hidden Accident Costs
Totally Hidden Costs
Iceberg Effect
Minimizing Losses
Example
Main Motivation
Profit-Driven
Cost Reduction
Fines
Cost of Non-Compliance
Increased Fines and Penalties
Highest Ever
Major Accidents
Cost–Benefit
Life’s Value
Reputation
Severe Repercussions
White Paper
Total Cost of Risk
Summary
Part IV Leading Safety Management Performance Indicators
Chapter 12 Safety Management Control
Leading Safety Management Performance Indicators (Measurements of Control)
Definition
Safety Controlling
Risk-based, Management-led, Audit-driven Safety Management System (SMS)
Measurable Performance Standards
Safety Authority
Safety Responsibility
Safety Accountability
System Standards
Measuring Performance
Critical Task Observation
External Audits
Internal Audit
Accident Investigation
Commendation
Recognition for the Achievement of Proactive Objectives
Management
Conclusion
Summary
Part V Examples of Positive Performance Safety Indicators (PPSIs)
Chapter 13 Near Miss Incidents as a Measurement of Safety Performance
Significance of Near Miss Incident Recording and Measurement
Not Just Quantity
Leading Performance Indicators
Near Miss Incidents (Close Calls)
Iceberg Effect
The Accident Ratio
Large Numbers
Benefits of Near Miss Incident Reporting
Measurement of Near Miss Incident Reporting
Formal Reporting
Near Miss Incident Report Record Log
Hazard Reporting System
5-Point Checklist
Safety Reporting Hotline
Informal Reporting
Risk Ranking
Measurement Criteria
Calculations
Monthly Totals
Rectification System
Feedback
Setting Targets
Example Metrics
Proactive Safety Performance Measurement
Summary
Chapter 14 High-Risk Behavior (Unsafe Act) and High-Risk Conditions (Unsafe Conditions)
Hazards
High-Risk Behavior (Unsafe Act)
High-Risk Workplace Condition (Unsafe Condition)
Immediate Energy Exchange Causes
Event and Consequence
Accident Ratio
Loss Causation Model
Accident Investigation
Metric
High-Risk Behaviors (Unsafe Acts)
A Safety Myth
High-Risk Behavior Is Not a Near Miss Incident
A Complex Situation
Human Failure
Inadvertent Failure
Deliberate Failure
Exceptional Failure
Active and Latent Failures
Errors
High-Risk Workplace Conditions
Identifying and Measuring Hazardous Situations
Safety Observation Program
Appointed Observer(s)
Checklist
Time of Observation
Observations Process
Safety Observation Card
Observations
The Observation Process
Discussions
Record Findings
Tracking System
Observation Metrics
Report
Incident Recall
Goal of Incident Recall
Summary
Chapter 15 Health and Safety Inspections
Key Performance Indicators
Inspections
Purpose of Safety Inspections
Types of Hazards
Safety Hazards
Biological Hazards
Chemical Hazards
Ergonomic Hazards
Physical Hazards
Psychosocial Hazards
Hazard Identification
Hazard Classification
Hazard Profiling
Measuring Against Standards
Checklist
Inspection Guidelines
Types of Inspections
Health and Safety Representatives’ Inspections
Risk Assessment Inspection
Legal Compliance
Informal Walk About
Planned Inspections
Safety Observation
Safety Department Inspection
Housekeeping Competition Inspection
Safety Survey
Safety Audit Inspection
Specific Equipment Inspections
Other Inspections
Conclusion
Summary
Chapter 16 Hazard Identification and Risk Assessment
The Purpose of Hazard Identification and Risk Assessment
Sources of Hazards and Hazard Burden
Measuring the Hazard Burden
Ongoing Assessments
Hierarchy of Control
Risk Assessment
Risk Register
Application of the HIRA Processes
Audit of an HIRA Process
Audit Protocol
Key Safety Performance Indicator
Summary
Chapter 17 Health and Safety Committee Meetings
Measurable Management Performance
A Health and Safety Committee
Joint Health and Safety Committee
Health and Safety Representatives’ Committee
Functions of Health and Safety Committees
Leadership
The Committee System
Meeting Agenda
Meeting Minutes
A Vital SMS Component
Summary
Chapter 18 Health and Safety Representatives Appointed
Health and Safety Representatives
Safety Management Principles
Principle of Safety Communication
Principle of Safety Participation
Principle of Safety Recognition
Who Should Be Appointed?
Training
Duties of Health and Safety Representatives
The Health and Safety Representative System
Positive Performance Indicator
Summary
Chapter 19 Safety Perceptions Surveys
Safety Perception Surveys
Hazard Identification
Improve Health and Safety
What Is the Purpose of a Safety Perception Survey?
Leading Indicator
Safety Perception Survey Objectives
Areas to Cover in the Survey
Survey Instrument and Questions
The Likert Scale
Benefits of Using Likert Scale Questionnaires
Feedback
Reevaluation
Summary
Chapter 20 Employees Trained in Health and Safety
Safety Management Principles
Accident Root Causes
Induction Training
Annual Refresher Training
First Aid Training
First Responder Training
Health and Safety Coordinators
Hazard Communication Training
Critical Task Training
Health and Safety Representative Training
Competency-Based Training
Technical Health and Safety Training
Formalized
Accident and Incident Recall
Key Performance Indicator
Summary
Chapter 21 Safety Toolbox Talks and Task Risk Assessments
Purpose of Toolbox Talks
Topics
Occupational Safety and Health Administration
Structured
Meaningful
Attendance Sheet
Task Risk Assessments
Key Performance Indicator
Summary
Chapter 22 Quality of Accident Investigation Reports
Accident Investigation
Quality of Investigations
Scoring an Accident Investigation Report
Evaluation Checklist
General Information (10 Points)
Risk Assessment (5 Points)
Description of the Event (15 Points)
Immediate (Cause of Energy Exchange) Cause Analysis (7 Points)
Root Cause Analysis (8 Points)
Sketches/Pictures/Diagrams
Risk Control Measures (Remedies) (30 Points)
Investigation Commencement (20 Points)
Signatures (5 Points)
Has the Accident Investigation Been Effective?
Summary
Part VI The Safety Management System (SMS) Audit as a Safety Management Performance Measurement Tool
Chapter 23 The SMS Audit as a Safety Management Performance Measurement Tool
Safety Management Performance Measurement
What Is an SMS Audit?
Not a Safety Inspection
Proactive Approach
Reactive Versus Proactive Measurement
Subjective Versus Objective
Benefits of SMS Audits
A Learning Opportunity
Types of SMS Audits
Baseline Audit
Records and Verification
Who Should Conduct the Baseline Audit?
Internal SMS Audits
Independent Audit (External Third Party)
Compliance Audit
Centralized and Decentralized SMS Coordination
Auditable Organization
Solution
Audit Requirements
Review of Element Standards
Document Control System
Incomplete Verification
Audit Frequency
Verification
SMS Audit Protocol
The Audit Protocol
Who Should Conduct Audits?
Auditor’s Training
Guidelines for Auditors
Auditor’s Experience
Lead Auditor
Questioning Techniques
Compliment
Summary
Chapter 24 Example Leading Safety Key Performance Indicators
Objective
Responsibility and Accountability
Requirements
Safety Committees
Scoring Method (Maximum 20 Points)
Alternate Score
Near Miss Incident Reports
Scoring Method (Maximum 10 Points)
Alternate Score
Safety Observations Reported
Scoring Method (Maximum 10 Points)
Alternate Score
Plant (Workplace) Inspections Completed
Scoring Method (Maximum 10 Points)
Alternate Score
Safety Management System Audit Results
Scoring Method (Maximum 5 Points)
Fire, Evacuation, or Emergency Drills Held
Scoring Method (Maximum 5 Points)
Number of Safety Toolbox Talks Held
Scoring Method (Maximum 10 Points)
Alternate Score
Employees Attending Health and Safety Training Programs or Workshops
Scoring Method (Maximum 5 Points)
Number of Safety Representatives Appointed and Active
Scoring Method (Maximum 15 Points)
Alternate Scores
Task or Site Risk Assessments Conducted
Scoring Method (Maximum 10 Points)
Score Sheet
Summary
References
Index
Read Less
People also search:
measuring safety management
measuring safety performance
measurable safety goals
metrics to measure safety performance
measure safety
You may also like…
Technique - Safety and Security
Safety Metrics for the Modern Safety Professional 1st Edition C. Gary Lopez
Technique - Safety and Security
Earth Sciences - Rivers & Lakes
Our Ancient Lakes A Natural History 1st Edition by Jeffrey Mckinnon 9780262373517 0262373513
Business & Economics - Project Management
Business & Economics - Human Resources
The Cause, Effect, and Control of Accidental Loss, 2nd Edition Ron C. Mckinnon
Technique - Transportation: Aviation

