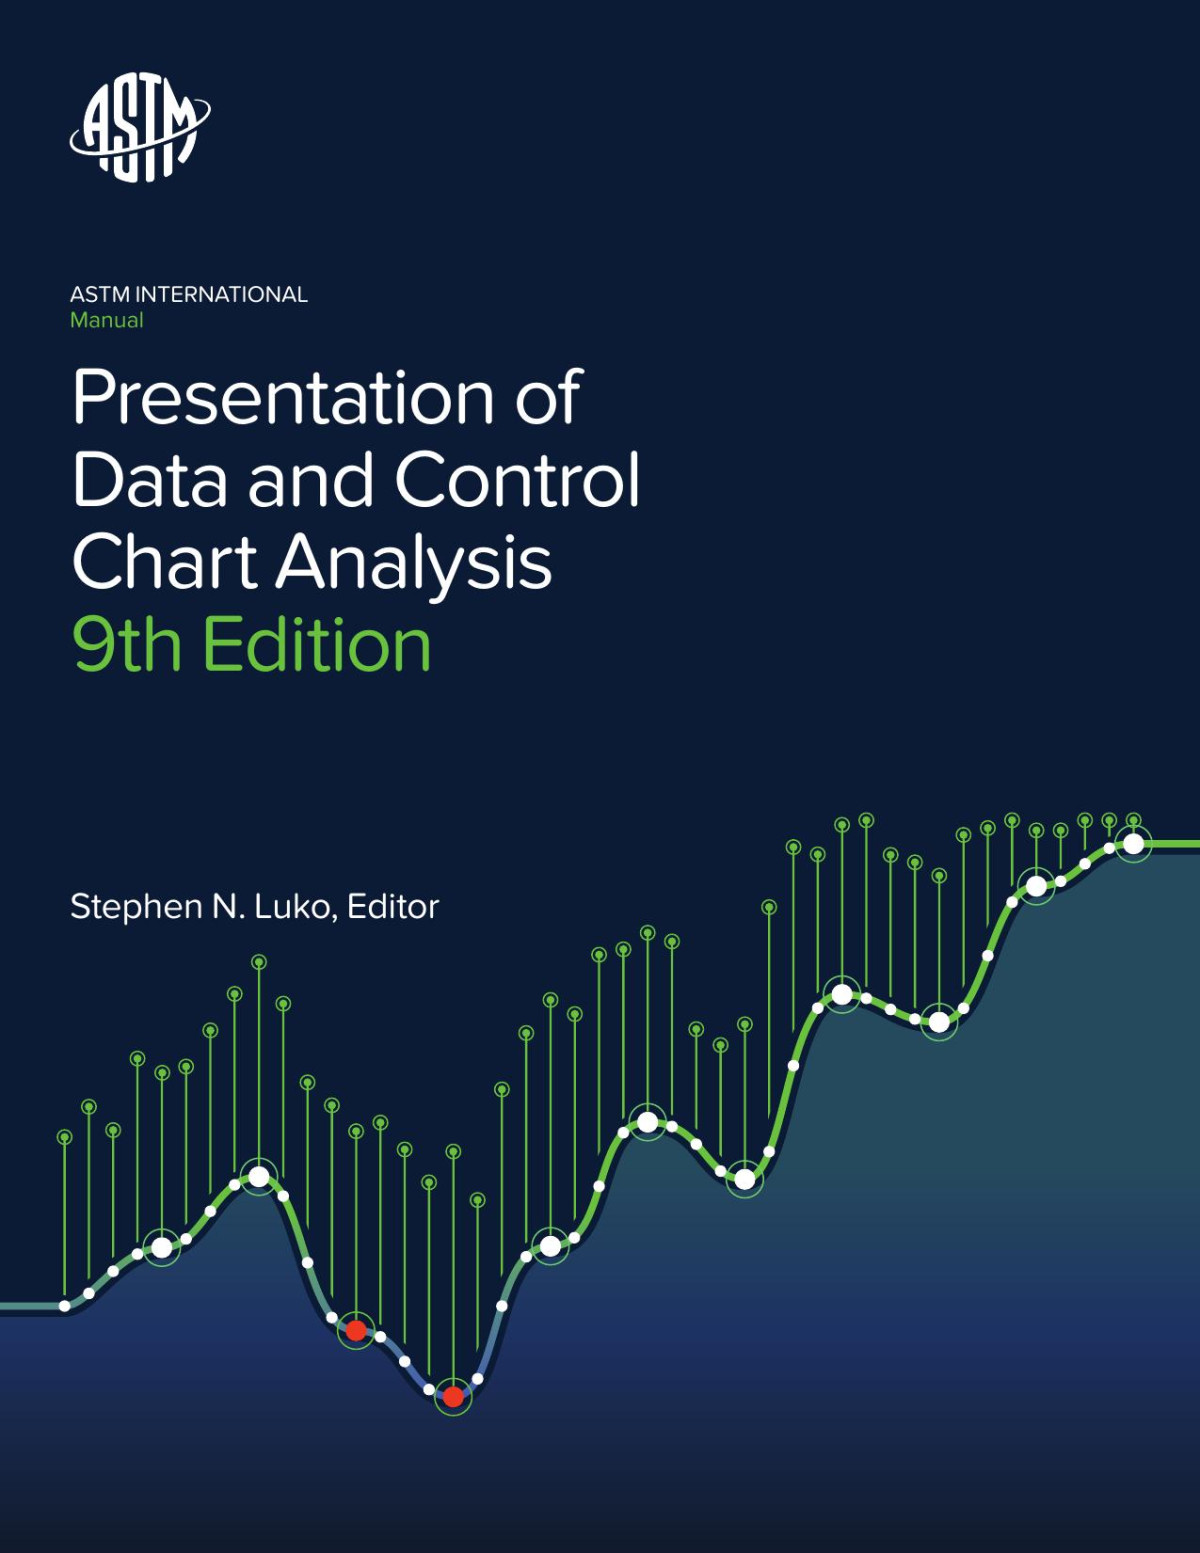
Manual on Presentation of Data and Control Chart Analysis 9th Edition by Astm International, Stephen N Luko ISBN 9780803171107 0803171102
$50.00 Original price was: $50.00.$25.00Current price is: $25.00.
Manual on Presentation of Data and Control Chart Analysis 9th Edition by Astm International, Stephen N Luko – Ebook PDF Instant Download/Delivery: 9780803171107 ,0803171102
Full download Manual on Presentation of Data and Control Chart Analysis 9th Edition after payment

Product details:
ISBN 10: 0803171102
ISBN 13: 9780803171107
Author: Astm International, Stephen N Luko
Manual on Presentation of Data and Control Chart Analysis 9th Edition Table of contents:
Introduction
-
Purpose
-
Type of Data Considered
-
Homogeneous Data
-
Typical Examples of Physical Data
-
Ungrouped Distribution
-
Empirical Percentiles and Order Statistics
Grouped Frequency Distributions
-
Introduction
-
Definitions
-
Choice of Bin Boundaries
-
Number of Bins
-
Tabular Presentation
-
Graphical Presentation
-
Cumulative Frequency Distribution
-
“Stem and Leaf” Diagram
-
Box Plot
Functions of a Frequency Distribution
-
Introduction
-
Relative Frequency
-
Average (Arithmetic Mean)
-
Other Measures of Central Tendency
-
Standard Deviation
-
Other Measures of Dispersion
-
Skewness—g₁
-
Kurtosis—g₂
-
Computational Tutorial
Amount of Information Contained in p, X, s, g₁, and g₂
-
Summarizing the Information
-
Several Values of Relative Frequency, p
-
Single Percentile of Relative Frequency, Qp
-
Average X Only
-
Average X and Standard Deviation s
-
Average X, Standard Deviation s, Skewness g₁, and Kurtosis g₂
-
Use of Coefficient of Variation Instead of the Standard Deviation
-
Summary—Amount of Information Contained in Simple Functions of the Data
The Probability Plot
-
Introduction
-
Normal Distribution Case
-
Weibull Distribution Case
Transformations
-
Introduction
-
Power (Variance-Stabilizing) Transformations
-
Box-Cox Transformations
-
Some Comments about the Use of Transformations
Essential Information
-
Introduction
-
What Functions of the Data Contain the Essential Information
-
Presenting X Only Versus Presenting X and s
-
Observed Relationships
-
Summary: Essential Information
Presentation of Relevant Information
-
Introduction
-
Relevant Information
-
Evidence of Control
Recommendations
-
Recommendations for Presentation of Data
-
References
PART 2 – Presenting Plus or Minus Limits of Uncertainty of an Observed Average
-
Glossary of Symbols Used in Part 2
-
Purpose
-
The Problem
-
Theoretical Background
-
Computation when σ Is Known
-
Computation when σ Is Unknown or the Sample Size Is Small
-
Interpretation
-
Experimental Illustration
-
Presentation of Data
-
One-Sided Limits
-
General Comments on the Use of Confidence Intervals
-
Number of Places to Be Retained in Computation and Presentation
Supplements
-
2.A: Presenting Plus or Minus Limits of Uncertainty for σ—Normal Distribution
-
2.B: Presenting Plus or Minus Limits of Uncertainty for p̂
-
2.C: Other Types of Statistical Intervals
-
2.D: Sample Size
-
References
PART 3 – Control Chart Method of Analysis and Presentation of Data
-
Glossary of Terms and Symbols Used in Part 3
General Principles
-
Purpose
-
Terminology and Technical Background
-
Two Uses
-
Breaking Up Data into Rational Subgroups
-
General Technique in Using Control Chart Method
-
Control Limits and Criteria of Control
Control—No Standard Given
-
Introduction
-
Control Charts for Averages (X) and Standard Deviations (s) — Large and Small Samples
-
Control Charts for Averages (X) and Ranges (R) — Small Samples
-
Summary of Control Charts without Given Standard
-
Control Charts for Attributes Data: p, np, u, c
-
Summary of Attribute Control Charts
Control with Respect to a Given Standard
-
Introduction
-
Control Charts for Averages, Standard Deviation, and Ranges
-
Summary of Charts with Given Standard
-
Attribute Control Charts with Standard
Control Charts for Individuals
-
Using Rational Subgroups
-
Using Moving Ranges
Examples
-
Examples for Various Chart Types with and without Standards
-
Control Charts for Individuals
Supplements
-
3.A: Mathematical Relations and Tables of Factors
-
3.B: Explanatory Notes
-
References
-
Selected Papers on Control Chart Techniques
PART 4 – Measurements and Other Topics of Interest
-
Glossary of Terms and Symbols Used in Part 4
The Measurement System
-
Introduction
-
Basic Properties of a Measurement Process
-
Repeatability Model
-
Reproducibility
-
Measurement System Bias
-
Using Measurement Error
-
Distinct Product Categories
Process Capability and Performance
-
Introduction
-
Process Capability
-
Process Capability Indices and Cpk
-
Process Performance Analysis
-
Using Process Performance Indices
-
Attribute Capability
-
References
Appendix
-
ASTM Standards under the Jurisdiction of Committee E11 on Quality and Statistics
Index
People also search for Manual on Presentation of Data and Control Chart Analysis 9th Edition:
t chart data
control manual
what is an example of a manual control
p control chart excel
rstudio manual pdf
Tags: Astm International, Stephen N Luko, Presentation, Control Chart Analysis
You may also like…
Uncategorized
Proceedings of the First International Colloquium on Numerical Analysis D. Bainov (Editor)
Biology and other natural sciences Biostatistics
Biostatistics Manual for Health Research: A Practical Guide to Data Analysis Nafis Faizi
Mathematics - Mathematical Statistics
Computers - Algorithms and Data Structures
Data Structures and Algorithm Analysis in C Solutions Manual 2nd Edition Mark Allen Weiss
Uncategorized
International Marketing Strategy Analysis Development and Implementation 9th Edition Annabel Ainscow
Science (General) - International Conferences and Symposiums


