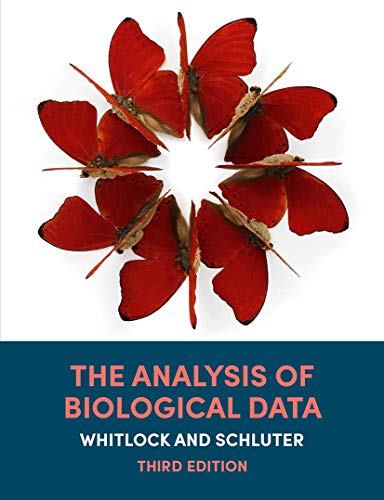
The Analysis of Biological Data 3rd Edition by Michael Whitlock, Dolph Schluter ISBN 1319226299 9781319226299
$50.00 Original price was: $50.00.$25.00Current price is: $25.00.
The Analysis of Biological Data 3rd Edition by Michael Whitlock, Dolph Schluter – Ebook PDF Instant Download/Delivery: 1319226299, 9781319226299
Full download The Analysis of Biological Data 3rd Edition after payment
Product details:
ISBN 10: 1319226299
ISBN 13: 9781319226299
Author: Michael Whitlock, Dolph Schluter
The Analysis of Biological Data 3rd Edition:
The Analysis of Biological Data provides students with a practical foundation of statistics for biology students. Every chapter has several biological or medical examples of key concepts, and each example is prefaced by a substantial description of the biological setting. The emphasis on real and interesting examples carries into the problem sets where students have dozens of practice problems based on real data.
The third edition features over 200 new examples and problems. These include new calculation practice problems, which guide the student step by step through the methods, and a greater number of examples and topics come from medical and human health research. Every chapter has been carefully edited for even greater clarity and ease of use. All the data sets, R scripts for all worked examples in the book, as well as many other teaching resources, are available to qualified instructors (see below).
The Analysis of Biological Data 3rd Edition Table of contents:
Chapter 1: Statistics and Samples 1.1 What is Statistics?
1.2 Sampling Populations
- Populations and Samples
- Properties of Good Samples
- Random Sampling
- How to Take a Random Sample
- The Sample of Convenience
- Volunteer Bias
- Data in the Real World
1.3 Types of Data and Variables - Categorical and Numerical Variables
- Explanatory and Response Variables
1.4 Frequency Distributions and Probability Distributions
1.5 Types of Studies
1.6 Summary
Chapter 1 Problems
- Practice Problems
- Assignment Problems
- Interleaf 1: Correlation Does Not Require Causation
Chapter 2: Displaying Data
2.1 Guidelines for Effective Graphs
- How to Draw a Bad Graph
- How to Draw a Good Graph
2.2 Showing Data for One Variable - Showing Categorical Data: Frequency Table and Bar Graph
- Making a Good Bar Graph
- A Bar Graph is Usually Better than a Pie Chart
- Showing Numerical Data: Frequency Table and Histogram
- Describing the Shape of a Histogram
- How to Draw a Good Histogram
- Other Graphs for Numerical Data
2.3 Showing Association Between Two Variables and Differences Between Groups - Showing Association Between Categorical Variables
- Showing Association Between Numerical Variables: Scatter Plot
- Showing Association Between a Numerical and a Categorical Variable
2.4 Showing Trends in Time and Space
2.5 How to Make Good Tables - Follow Similar Principles for Display Tables
2.6 How to Make Data Files
2.7 Summary
Chapter 2 Problems
- Practice Problems
- Assignment Problems
Chapter 3: Describing Data
3.1 Arithmetic Mean and Standard Deviation
- The Sample Mean
- Variance and Standard Deviation
- Rounding Means, Standard Deviations, and Other Quantities
- Coefficient of Variation
- Calculating Mean and Standard Deviation from a Frequency Table
- Effect of Changing Measurement Scale
3.2 Median and Interquartile Range - The Median
- The Interquartile Range
- The Box Plot
3.3 How Measures of Location and Spread Compare - Mean Versus Median
- Standard Deviation Versus Interquartile Range
3.4 Cumulative Frequency Distribution - Percentiles and Quantiles
- Displaying Cumulative Relative Frequencies
3.5 Proportions - Calculating a Proportion
- The Proportion is Like a Sample Mean
3.6 Summary
3.7 Quick Formula Summary - Table of Formulas for Descriptive Statistics
Chapter 3 Problems
- Practice Problems
- Assignment Problems
Chapter 4: Estimating with Uncertainty
4.1 The Sampling Distribution of an Estimate
- Estimating Mean Gene Length with a Random Sample
- The Sampling Distribution of Y¯
4.2 Measuring the Uncertainty of an Estimate - Standard Error
- The Standard Error of Y¯
- The Standard Error of Y¯ from Data
4.3 Confidence Intervals - The 2SE Rule of Thumb
4.4 Error Bars
4.5 Summary
4.6 Quick Formula Summary - Standard Error of the Mean
Chapter 4 Problems
- Practice Problems
- Assignment Problems
- Interleaf 2: Pseudoreplication
Chapter 5: Probability
5.1 The Probability of an Event
5.2 Venn Diagrams
5.3 Mutually Exclusive Events
5.4 Probability Distributions
- Discrete Probability Distributions
- Continuous Probability Distributions
5.5 Either This or That: Adding Probabilities - The Addition Rule
- The Probabilities of All Possible Mutually Exclusive Outcomes Add to One
- The General Addition Rule
5.6 Independence and the Multiplication Rule - Multiplication Rule
- “And” Versus “Or”
- Independence of More Than Two Events
5.7 Probability Trees
5.8 Dependent Events
5.9 Conditional Probability and Bayes’ Theorem - Conditional Probability
- The General Multiplication Rule
- Sampling Without Replacement
- Bayes’ Theorem
5.10 Summary
Chapter 5 Problems
- Practice Problems
- Assignment Problems
Chapter 6: Hypothesis Testing
6.1 Making and Using Statistical Hypotheses
- Null Hypothesis
- Alternative Hypothesis
- To Reject or Not to Reject
6.2 Hypothesis Testing: An Example - Stating the Hypotheses
- The Test Statistic
- The Null Distribution
- Quantifying Uncertainty: The P-value
- Draw the Appropriate Conclusion
- Reporting the Results
6.3 Errors in Hypothesis Testing - Type I and Type II Errors
6.4 When the Null Hypothesis is Not Rejected - The Test
- Interpreting a Nonsignificant Result
6.5 One-Sided Tests
6.6 Hypothesis Testing Versus Confidence Intervals
6.7 Summary
Chapter 6 Problems
- Practice Problems
- Assignment Problems
- Interleaf 3: Why Statistical Significance is Not the Same as Biological Importance
People also search for The Analysis of Biological Data 3rd Edition:
the analysis of biological data pdf free download
the analysis of biological data 3rd edition assignment problem solutions
the analysis of biological data 3rd edition answers
the analysis of biological data 3rd edition answer key
the analysis of biological data whitlock and schluter
Tags:
Michael Whitlock,Dolph Schluter,The Analysis,Biological,Data
You may also like…
Computers - Organization and Data Processing
Analysis of Distributional Data 1st Edition by Paula Brito, Sónia Dias ISBN 9781498725453 1498725457
Biology and other natural sciences - Biotechnology
Biological Data Integration: Computer and Statistical Approaches 1st Edition Christine Froidevaux
Mathematics - Mathematical Statistics
Practical data analysis with jmp Third Edition Robert Carver
Computers - Applications & Software
Applications of Machine Learning and Deep Learning on Biological Data 1st Edition Faheem Masoodi
Biology and other natural sciences
Romance - Contemporary Romance
Forbidden Hearts 1 Whitlock Family 1st Edition by Corinne Michaels ISBN B0BRK5PT3G 9781957309132
Uncategorized
Biography & Autobiography - Science
10 Women Who Changed Science and the World Catherine Whitlock

