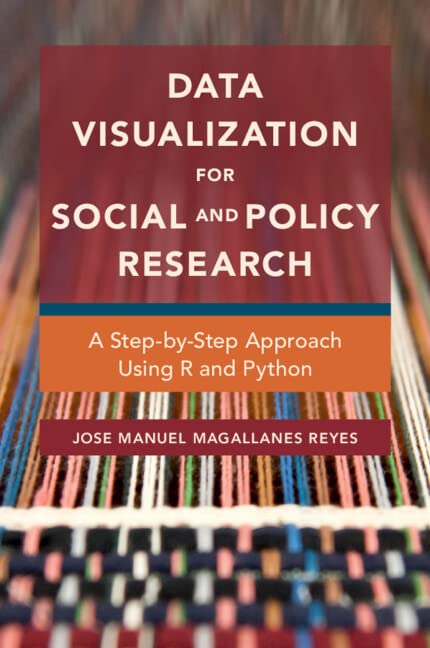
Data Visualization for Social and Policy Research A Step by Step Approach Using R and Python 1st Edition by Jose Manuel Magallanes Reyes ISBN 1108787878 9781108787871
$50.00 Original price was: $50.00.$25.00Current price is: $25.00.
Data Visualization for Social and Policy Research: A Step-by-Step Approach Using R and Python 1st Edition by Jose Manuel Magallanes Reyes – Ebook PDF Instant Download/Delivery: 1108787878, 978-1108787871
Full dowload Data Visualization for Social and Policy Research: A Step-by-Step Approach Using R and Python 1st Edition after payment
Product details:
ISBN 10: 1108787878
ISBN 13: 978-1108787871
Author: Jose Manuel Magallanes Reyes
Data Visualization for Social and Policy Research: A Step-by-Step Approach Using R and Python 1st Edition: All social and policy researchers need to synthesize data into a visual representation. Producing good visualizations combines creativity and technique. This book teaches the techniques and basics to produce a variety of visualizations, allowing readers to communicate data and analyses in a creative and effective way. Visuals for tables, time series, maps, text, and networks are carefully explained and organized, showing how to choose the right plot for the type of data being analysed and displayed. Examples are drawn from public policy, public safety, education, political tweets, and public health. The presentation proceeds step by step, starting from the basics, in the programming languages R and Python so that readers learn the coding skills while simultaneously becoming familiar with the advantages and disadvantages of each visualization. No prior knowledge of either Python or R is required. Code for all the visualizations are available from the book’s website.
Data Visualization for Social and Policy Research: A Step-by-Step Approach Using R and Python 1st Edition Table of contents:
1. Introduction
1.1. Some Assumptions
1.2. R and Python Environments
1.3. The Rest of the Book
1.4. How to Read This Book
1.5. Acknowledgements
PART ONE: Getting Started
2. Data for Plotting
2.1. Data-Types
2.2. Data Types in R and Python
2.3. Dataset Structure
3. Visualization Basics
3.1. Elements of Information Visualization
3.2. Beyond Default
3.3. Python’s Grammar of Graphics
PART TWO: Visualizing Tabular Data
4. Insights from ONE Variable
4.1. Information from ONE Variable
4.2. Categorical I: Visualizing Gaps
4.3. Categorical II: Visualizing Representativity
4.4. Categorical III: Diversity and Inequality
4.5. Categorical IV: Symmetry and Position
4.6. Numerical I: Dispersion
4.7. Numerical II: Shape
4.8. Numerical III: Numerical Inequality
5. Insights from TWO Variables
5.1. Cat–Cat Relationships
5.2. Cat–Num Relationship
5.3. Num–Num Relationship
6. Insights from THREE or More Variables
6.1. Partitioning with Facets
6.2. Color Intensity
6.3. Simultaneity
6.4. Area
PART THREE: Beyond Tabular Data
7. Geospatial Data
7.1. Data Suitable for Maps
7.2. Map Files
7.3. Combining Maps and Data
7.4. Focusing on Map Zones
7.5. Customizing Color and Size
8. Data from the Social Network
8.1. Getting Access
8.2. Getting Texts
8.3. Visuals Based on Text
8.4. Visuals Based on Actors
People also search for Data Visualization for Social and Policy Research: A Step-by-Step Approach Using R and Python 1st Edition:
data visualization research topics
data visualization topics
data visualization requirements
what is data visualization ppt
data visualization for public health
You may also like…
Computers - Computer Science
Politics & Philosophy - Social Sciences
Medicine - Clinical Medicine
Medicine - Surgery
Computers - Computer Science
Mathematics - Mathematical Statistics
Bayesian Statistics for Beginners A Step by Step Approach Therese M. Donovan
Mathematics
Reference - Other Reference By Subject
Thinking Critically about Research A Step by Step Approach 1st Edition Jane Ogden
Biology and other natural sciences Biostatistics

