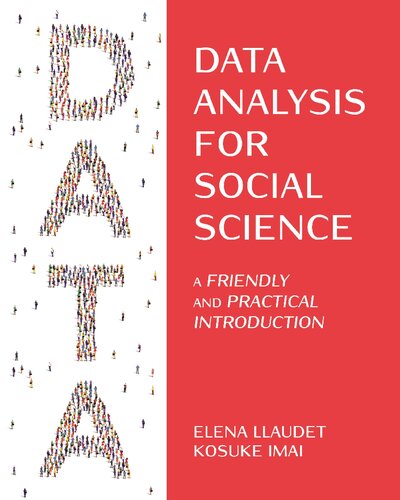
Data Analysis for Social Science by Elena Llaudet, Kosuke Imai 9780691229348 0691229341
$50.00 Original price was: $50.00.$25.00Current price is: $25.00.
Data Analysis for Social Science Elena Llaudet – Ebook Instant Download/Delivery ISBN(s): 9780691199436,0691199434,9780691229348 0691229341
Product details:
- ISBN 10: 0691229341
- ISBN 13: 9780691229348
- Author: Elena Llaudet, Kosuke Imai
Data Analysis for Social Science
A Friendly and Practical Introduction
Table contents:
1. Introduction
1.1 Book Overview
1.2 Chapter Summaries
1.3 How to Use This Book
1.4 Why Learn to Analyze Data?
1.4.1 Learning to Code
1.5 Getting Ready
1.6 Introduction to R
1.6.1 Doing Calculations in R
1.6.2 Creating Objects in R
1.6.3 Using Functions in R
1.7 Loading and Making Sense of Data
1.7.1 Setting the Working Directory
1.7.2 Loading the Dataset
1.7.3 Understanding the Data
1.7.4 Identifying the Types of Variables Included
1.7.5 Identifying the Number of Observations
1.8 Computing and Interpreting Means
1.8.1 Accessing Variables inside Dataframes
1.8.2 Means
1.9 Summary
1.10 Cheatsheets
1.10.1 Concepts and Notation
1.10.2 R Symbols and Operators
1.10.3 R Functions
2. Estimating Causal Effects with Randomized Experiments
2.1 Project STAR
2.2 Treatment and Outcome Variables
2.2.1 Treatment Variables
2.2.2 Outcome Variables
2.3 Individual Causal Effects
2.4 Average Causal Effects
2.4.1 Randomized Experiments and the Difference-in-Means Estimator
2.5 Do Small Classes Improve Student Performance?
2.5.1 Relational Operators in R
2.5.2 Creating New Variables
2.5.3 Subsetting Variables
2.6 Summary
2.7 Cheatsheets
2.7.1 Concepts and Notation
2.7.2 R Symbols and Operators
2.7.3 R Functions
3. Inferring Population Characteristics via Survey Research
3.1 The EU Referendum in the UK
3.2 Survey Research
3.2.1 Random Sampling
3.2.2 Potential Challenges
3.3 Measuring Support for Brexit
3.3.1 Predicting the Referendum Outcome
3.3.2 Frequency Tables
3.3.3 Tables of Proportions
3.4 Who Supported Brexit?
3.4.1 Handling Missing Data
3.4.2 Two-Way Frequency Tables
3.4.3 Two-Way Tables of Proportions
3.4.4 Histograms
3.4.5 Density Histograms
3.4.6 Descriptive Statistics
3.5 Relationship between Education and the Leave Vote in the Entire UK
3.5.1 Scatter Plots
3.5.2 Correlation
3.6 Summary
3.7 Cheatsheets
3.7.1 Concepts and Notation
3.7.2 R Symbols and Operators
3.7.3 R Functions
4. Predicting Outcomes Using Linear Regression
4.1 GDP and Night-Time Light Emissions
4.2 Predictors, Observed vs. Predicted Outcomes, and Prediction Errors
4.3 Summarizing the Relationship between Two Variables with a Line
4.3.1 The Linear Regression Model
4.3.2 The Intercept Coefficient
4.3.3 The Slope Coefficient
4.3.4 The Least Squares Method
4.4 Predicting GDP Using Prior GDP
4.4.1 Relationship between GDP and Prior GDP
4.4.2 With Natural Logarithm Transformations
4.5 Predicting GDP Growth Using Night-Time Light Emissions
4.6 Measuring How Well the Model Fits the Data with the Coefficient of Determination, R2
4.6.1 How Well Do the Three Predictive Models in This Chapter Fit the Data?
4.7 Summary
4.8 Appendix: Interpretation of the Slope in the Log-Log Linear Model
4.9 Cheatsheets
4.9.1 Concepts and Notation
4.9.2 R Functions
5. Estimating Causal Effects with Observational Data
5.1 Russian State-Controlled TV Coverage of 2014 Ukrainian Affairs
5.2 Challenges of Estimating Causal Effects with Observational Data
5.2.1 Confounding Variables
5.2.2 Why Are Confounders a Problem?
5.2.3 Confounders in Randomized Experiments
5.3 The Effect of Russian TV on Ukrainians’ Voting Behavior
5.3.1 Using the Simple Linear Model to Compute the Difference-in-Means Estimator
5.3.2 Controlling for Confounders Using a Multiple Linear Regression Model
5.4 The Effect of Russian TV on Ukrainian Electoral Outcomes
5.4.1 Using the Simple Linear Model to Compute the Difference-in-Means Estimator
5.4.2 Controlling for Confounders Using a Multiple Linear Regression Model
5.5 Internal and External Validity
5.5.1 Randomized Experiments vs. Observational Studies
5.5.2 The Role of Randomization
5.5.3 How Good Are the Two Causal Analyses in This Chapter?
5.5.4 How Good Was the Causal Analysis in Chapter 2?
5.5.5 The Coefficient of Determination, R2
5.6 Summary
5.7 Cheatsheets
5.7.1 Concepts and Notation
5.7.2 R Functions
6. Probability
6.1 What Is Probability?
6.2 Axioms of Probability
6.3 Events, Random Variables, and Probability Distributions
6.4 Probability Distributions
6.4.1 The Bernoulli Distribution
6.4.2 The Normal Distribution
6.4.3 The Standard Normal Distribution
6.4.4 Recap
6.5 Population Parameters vs. Sample Statistics
6.5.1 The Law of Large Numbers
6.5.2 The Central Limit Theorem
6.5.3 Sampling Distribution of the Sample Mean
6.6 Summary
6.7 Appendix: For Loops
6.8 Cheatsheets
6.8.1 Concepts and Notation
6.8.2 R Symbols and Operators
6.8.3 R Functions
7. Quantifying Uncertainty
7.1 Estimators and Their Sampling Distributions
7.2 Confidence Intervals
7.2.1 For the Sample Mean
7.2.2 For the Difference-in-Means Estimator
7.2.3 For Predicted Outcomes
7.3 Hypothesis Testing
7.3.1 With the Difference-in-Means Estimator
7.3.2 With Estimated Regression Coefficients
7.4 Statistical vs. Scientific Significance
7.5 Summary
7.6 Cheatsheets
7.6.1 Concepts and Notation
7.6.2 R Symbols and Operators
7.6.3 R Functions
People also search:
data analysis for social science
statistics and data analysis for social science
data analysis for social science llaudet
statistics and data analysis for social science pdf
data analysis for social science pdf free download
You may also like…
Computers - Computer Science
Computers - Databases
Applied Longitudinal Data Analysis for Medical Science: A Practical Guide 3rd Edition Twisk
Computers - Programming
Computers - Programming
Numerical Methods Using Java: For Data Science, Analysis, and Engineering Haksun Li
Computers - Artificial Intelligence (AI)
Mathematics
Data Analysis for the Social Sciences Integrating Theory and Practice 1st Edition Douglas Bors
Arts - Museums & Collections

