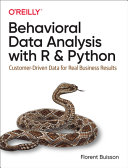
Behavioral Data Analysis with R and Python Customer Driven Data for Real Business Results 1st Edition by Florent Buisson ISBN 9781492061373 1492061379
$50.00 Original price was: $50.00.$25.00Current price is: $25.00.
Behavioral Data Analysis with R and Python Customer Driven Data for Real Business Results 1st Edition by Florent Buisson – Ebook PDF Instant Download/Delivery: 9781492061373 ,1492061379
Full download Behavioral Data Analysis with R and Python Customer Driven Data for Real Business Results 1st Edition after payment
Product details:
ISBN 10: 1492061379
ISBN 13: 9781492061373
Author: Florent Buisson
Behavioral Data Analysis with R and Python Customer Driven Data for Real Business Results 1st Edition Table of contents:
I. Understanding Behaviors
1. The Causal-Behavioral Framework for Data Analysis
Why We Need Causal Analytics to Explain Human Behavior
The Different Types of Analytics
Human Beings Are Complicated
Confound It! The Hidden Dangers of Letting Regression Sort It Out
Data
Why Correlation Is Not Causation: A Confounder in Action
Too Many Variables Can Spoil the Broth
Conclusion
2. Understanding Behavioral Data
A Basic Model of Human Behavior
Personal Characteristics
Cognition and Emotions
Intentions
Actions
Business Behaviors
How to Connect Behaviors and Data
Develop a Behavioral Integrity Mindset
Distrust and Verify
Identify the Category
Refine Behavioral Variables
Understand the Context
Conclusion
II. Causal Diagrams and Deconfounding
3. Introduction to Causal Diagrams
Causal Diagrams and the Causal-Behavioral Framework
Causal Diagrams Represent Behaviors
Causal Diagrams Represent Data
Fundamental Structures of Causal Diagrams
Chains
Forks
Colliders
Common Transformations of Causal Diagrams
Slicing/Disaggregating Variables
Aggregating Variables
What About Cycles?
Paths
Conclusion
4. Building Causal Diagrams from Scratch
Business Problem and Data Setup
Data and Packages
Understanding the Relationship of Interest
Identify Candidate Variables to Include
Actions
Intentions
Cognition and Emotions
Personal Characteristics
Business Behaviors
Time Trends
Validate Observable Variables to Include Based on Data
Relationships Between Numeric Variables
Relationships Between Categorical Variables
Relationships Between Numeric and Categorical Variables
Expand Causal Diagram Iteratively
Identify Proxies for Unobserved Variables
Identify Further Causes
Iterate
Simplify Causal Diagram
Conclusion
5. Using Causal Diagrams to Deconfound Data Analyses
Business Problem: Ice Cream and Bottled Water Sales
The Disjunctive Cause Criterion
Definition
First Block
Second Block
The Backdoor Criterion
Definitions
First Block
Second Block
Conclusion
III. Robust Data Analysis
6. Handling Missing Data
Data and Packages
Visualizing Missing Data
Amount of Missing Data
Correlation of Missingness
Diagnosing Missing Data
Causes of Missingness: Rubin’s Classification
Diagnosing MCAR Variables
Diagnosing MAR Variables
Diagnosing MNAR Variables
Missingness as a Spectrum
Handling Missing Data
Introduction to Multiple Imputation (MI)
Default Imputation Method: Predictive Mean Matching
From PMM to Normal Imputation (R Only)
Adding Auxiliary Variables
Scaling Up the Number of Imputed Data Sets
Conclusion
7. Measuring Uncertainty with the Bootstrap
Intro to the Bootstrap: “Polling” Oneself Up
Packages
The Business Problem: Small Data with an Outlier
Bootstrap Confidence Interval for the Sample Mean
Bootstrap Confidence Intervals for Ad Hoc Statistics
The Bootstrap for Regression Analysis
When to Use the Bootstrap
Conditions for the Traditional Central Estimate to Be Sufficient
Conditions for the Traditional CI to Be Sufficient
Determining the Number of Bootstrap Samples
Optimizing the Bootstrap in R and Python
R: The BehavioralDataAnalysis Package
Python Optimization
Conclusion
IV. Designing and Analyzing Experiments
8. Experimental Design: The Basics
Planning the Experiment: Theory of Change
Business Goal and Target Metric
Intervention
Behavioral Logic
Data and Packages
Determining Random Assignment and Sample Size/Power
Random Assignment
Sample Size and Power Analysis
Analyzing and Interpreting Experimental Results
Conclusion
9. Stratified Randomization
Planning the Experiment
Business Goal and Target Metric
Definition of the Intervention
Behavioral Logic
Data and Packages
Determining Random Assignment and Sample Size/Power
Random Assignment
Power Analysis with Bootstrap Simulations
Analyzing and Interpreting Experimental Results
Intention-to-Treat Estimate for Encouragement Intervention
Complier Average Causal Estimate for Mandatory Intervention
Conclusion
10. Cluster Randomization and Hierarchical Modeling
Planning the Experiment
Business Goal and Target Metric
Definition of the Intervention
Behavioral Logic
Data and Packages
Introduction to Hierarchical Modeling
R Code
Python Code
Determining Random Assignment and Sample Size/Power
Random Assignment
Power Analysis
Analyzing the Experiment
Conclusion
V. Advanced Tools in Behavioral Data Analysis
11. Introduction to Moderation
Data and Packages
Behavioral Varieties of Moderation
Segmentation
Interactions
Nonlinearities
How to Apply Moderation
When to Look for Moderation?
Multiple Moderators
Validating Moderation with Bootstrap
Interpreting Individual Coefficients
Conclusion
12. Mediation and Instrumental Variables
Mediation
Understanding Causal Mechanisms
Causal Biases
Identifying Mediation
Measuring Mediation
Instrumental Variables
Data
Packages
Understanding and Applying IVs
Measurement
Applying IVs: Frequently Asked Questions
Conclusion
Bibliography
Index
People also search for Behavioral Data Analysis with R and Python Customer Driven Data for Real Business Results 1st Edition:
p value binary data
q data analysis software
q data psychology
r data analysis examples
use r for data analysis
Tags: Florent Buisson, Behavioral Data Analysis, Customer Driven Data
You may also like…
Computers - Internet & World Wide Web
Business & Economics - Management & Leadership
Computers - Artificial Intelligence (AI)
Computers - Programming
Business & Economics - Sales & Marketing
Data Science for Business With R 1st Edition Jeffrey S. Saltz
Computers - Programming
Computers - Programming
Data Analysis with Python and PySpark 1st Edition Jonathan Rioux


