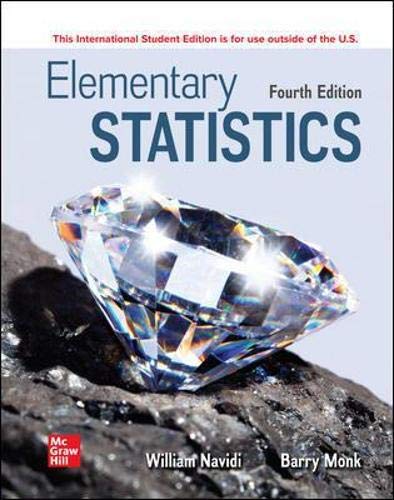
Elementary Statistics 4th Edition by William Navidi, Barry Monk ISBN 9781264417001 1264417004
$50.00 Original price was: $50.00.$25.00Current price is: $25.00.
Elementary Statistics 4th Edition by William Navidi, Barry Monk – Ebook PDF Instant Download/Delivery: 9781264417001 ,1264417004
Full download Elementary Statistics 4th Edition after payment
Product details:
ISBN 10: 1264417004
ISBN 13: 9781264417001
Author: William Navidi, Barry Monk
Elementary Statistics 4th Edition Table of contents:
Chapter 1: Basic Ideas
Chapter 1 Introduction
Introduction
1.1 Sampling
Simple Random Sampling
Samples of Convenience
Problems with samples of convenience
Some Other Sampling Methods
Statistics and Parameters
Section 1.1 Exercises
1.2 Types of Data
Data Sets
Qualitative and Quantitative Variables
Ordinal and Nominal Variables
Discrete and Continuous Variables
Ratio and Interval Levels of Measurement
Section 1.2 Exercises
1.3 Design of Experiments
Experiments and Observational Studies
Randomized Experiments
Observational Studies
Types of Observational Studies
Section 1.3 Exercises
1.4 Bias in Studies
Defining Bias
Identifying Sources of Bias
A Big Sample Size Doesn’t Make Up for Bias
Section 1.4 Exercises
Chapter 1 Summary
Vocabulary and Notation
Chapter Quiz
Review Exercises
Write About It
Activities
Case Study: Air Pollution And Respiratory Symptoms
Chapter 2: Graphical Summaries of Data
Chapter 2 Introduction
Introduction
2.1 Graphical Summaries for Qualitative Data
Frequency Distributions for Qualitative Data
Relative frequency distributions
Bar Graphs
Pareto charts
Pie Charts
Section 2.1 Exercises
2.2 Frequency Distributions and Their Graphs
Frequency Distributions for Quantitative Data
Histograms
Shapes of Histograms
Frequency Polygons and Ogives
Section 2.2 Exercises
2.3 More Graphs for Quantitative Data
Stem-and-Leaf Plots
Dotplots
Time-Series Plots
Section 2.3 Exercises
2.4 Graphs Can Be Misleading
Positioning the Vertical Scale
The Area Principle
Three-Dimensional Graphs and Perspective
Section 2.4 Exercises
Chapter 2 Summary
Vocabulary and Notation
Chapter Quiz
Review Exercises
Write About It
Activities
Case Study: Do Hybrid Cars Get Better Gas Mileage?
Chapter 3: Numerical Summaries of Data
Chapter 3 Introduction
Introduction
3.1 Measures of Center
The Mean
The Median
Comparing the Properties of the Mean and Median
The Mode
Approximating the Mean with Grouped Data
The Weighted Mean
Section 3.1 Exercises
3.2 Measures of Spread
The Range
The Variance
The Standard Deviation
Approximating the Standard Deviation with Grouped Data
The Empirical Rule
Chebyshev’s Inequality
The Coefficient of Variation
Section 3.2 Exercises
3.3 Measures of Position
The z-Score
Quartiles
Percentiles
The Five-Number Summary
Outliers
Boxplots
Section 3.3 Exercises
Chapter 3 Summary
Vocabulary and Notation
Important Formulas
Chapter Quiz
Review Exercises
Write About It
Activities
Case Study: Can Recycled Materials Be Used In Electronic Devices?
Chapter 4: Summarizing Bivariate Data
Chapter 4 Introduction
Introduction
4.1 Correlation
Scatterplots
The Correlation Coefficient
Correlation Is Not Causation
Section 4.1 Exercises
4.2 The Least-Squares Regression Line
The Least-Squares Regression Line
Using the Least-Squares Regression Line for Prediction
Interpreting the Least-Squares Regression Line
Section 4.2 Exercises
4.3 Features and Limitations of the Least-Squares Regression Line
Don’t Make Predictions Outside the Range of the Data
Construct a Residual Plot to Determine Whether a Relationship Is Linear
Outliers and Influential Points
The Coefficient of Determination
Section 4.3 Exercises
Chapter 4 Summary
Vocabulary and Notation
Important Formulas
Chapter Quiz
Review Exercises
Write About It
Activities
Case Study: How are Inflation and Unemployment Related?
Chapter 5: Probability
Chapter 5 Introduction
Introduction
5.1 Basic Concepts of Probability
Probability Models
Approximating Probabilities with the Empirical Method
Simulation
Section 5.1 Exercises
5.2 The Addition Rule and the Rule of Complements
The General Addition Rule
Mutually Exclusive Events
Complements
Section 5.2 Exercises
5.3 Conditional Probability and the Multiplication Rule
Conditional Probability
The General Multiplication Rule
Independence
Determining Which Method to Use
Section 5.3 Exercises
5.4 Counting
The Fundamental Principle of Counting
Permutations
Combinations
Section 5.4 Exercises
Chapter 5 Summary
Vocabulary and Notation
Important Formulas
Chapter Quiz
Review Exercises
Write About It
Activities
Case Study: How Likely Are You To Live To Age 100?
Chapter 6: Discrete Probability Distributions
Chapter 6 Introduction
Introduction
6.1 Random Variables
Connection Between Probability Distributions and Populations
Section 6.1 Exercises
6.2 The Binomial Distribution
Binomial Random Variables
The Binomial Probability Distribution
Computing Binomial Probabilities
Mean and Variance of a Binomial Random Variable
Section 6.2 Exercises
6.3 The Poisson Distribution
Mean and Variance of the Poisson Distribution
The Poisson Approximation to the Binomial Distribution
Section 6.3 Exercises
Chapter 6 Summary
Vocabulary and Notation
Important Formulas
Chapter Quiz
Review Exercises
Write About It
Activities
Case Study: Benford’s Law: Do The Digits 1–9 Occur Equally Often?
Chapter 7: The Normal Distribution
Chapter 7 Introduction
Introduction
7.1 The Standard Normal Curve
The Uniform Distribution
The Normal Distribution
Finding Areas Under the Standard Normal Curve
Finding a z-Score Corresponding to a Given Area
Section 7.1 Exercises
7.2 Applications of the Normal Distribution
Converting Normal Values to z-Scores
Finding Areas Under a Normal Curve
Finding the Value from a Normal Distribution Corresponding to a Given Proportion
Section 7.2 Exercises
7.3 Sampling Distributions and the Central Limit Theorem
An Example of a Sampling Distribution
Computing Probabilities with the Central Limit Theorem
Section 7.3 Exercises
7.4 The Central Limit Theorem for Proportions
An Example of a Sampling Distribution
Computing Probabilities with the Central Limit Theorem
Section 7.4 Exercises
7.5 The Normal Approximation to the Binomial Distribution
Section 7.5 Exercises
7.6 Assessing Normality
Dotplots
Boxplots
Histograms
Stem-and-Leaf Plots
Normal Quantile Plots
Section 7.6 Exercises
Chapter 7 Summary
Vocabulary and Notation
Important Formulas
Chapter Quiz
Review Exercises
Write About It
Activities
Case Study: Testing The Strength Of Cans
Chapter 8: Confidence Intervals
Chapter 8 Introduction
Introduction
8.1 Confidence Intervals for a Population Mean, Standard Deviation Known
The Investigative Process of Statistics
Estimating a Population Mean
Section 8.1 Exercises
8.2 Confidence Intervals for a Population Mean, Standard Deviation Unknown
The Student’s t Distribution
Constructing a Confidence Interval for μ When σ Is Unknown
More Confidence Means a Bigger Margin of Error
Finding the Necessary Sample Size
Distinguish Between Confidence and Probability
Section 8.2 Exercises
8.3 Confidence Intervals for a Population Proportion
Construct a Confidence Interval for a Population Proportion
Finding the Necessary Sample Size
A Method for Constructing Confidence Intervals with Small Samples
Constructing a confidence interval for a proportion
Section 8.3 Exercises
8.4 Confidence Intervals for a Standard Deviation
The Chi-Square Distribution
Confidence Intervals for the Variance and Standard Deviation
Section 8.4 Exercises
8.5 Determining Which Method to Use
Section 8.5 Exercises
Chapter 8 Summary
Vocabulary and Notation
Important Formulas
Chapter Quiz
Review Exercises
Write About It
Activities
Case Study: Do Newer Wood Stoves Produce Less Pollution?
Chapter 9: Hypothesis Testing
Chapter 9 Introduction
Introduction
9.1 Basic Principles of Hypothesis Testing
The Null Hypothesis and the Alternate Hypothesis
The Reasoning Used in Hypothesis Testing
Stating Conclusions
Type I and Type II Errors
Section 9.1 Exercises
9.2 Hypothesis Tests for a Population Mean, Standard Deviation Known
The Critical Value Method
The P-Value Method
Section 9.2 Exercises
9.3 Hypothesis Tests for a Population Mean, Standard Deviation Unknown
Estimating the P-Value from a Table
Testing a Hypothesis About a Population Mean Using the Critical Value Method
The Relationship Between Hypothesis Tests and Confidence Intervals
The Relationship Between α and the Probability of an Error
Report the P-Value or the Test Statistic Value
Statistical Significance Is Not the Same as Practical Significance
Section 9.3 Exercises
9.4 Hypothesis Tests for Proportions
Performing a hypothesis test with technology
Testing Hypotheses for a Proportion Using the Critical Value Method
Section 9.4 Exercises
9.5 Hypothesis Tests for a Standard Deviation
Hypothesis Tests for the Standard Deviation
Section 9.5 Exercises
9.6 Determining Which Method to Use
Section 9.6 Exercises
9.7 Power
Section 9.7 Exercises
Chapter 9 Summary
Vocabulary and Notation
Important Formulas
Chapter Quiz
Review Exercises
Write About It
Activities
Case Study: Is It Getting Warmer In Washington, D.C.?
Chapter 10: Two-Sample Confidence Intervals
Chapter 10 Introduction
Introduction
10.1 Confidence Intervals for the Difference Between Two Means: Independent Samples
Construct Confidence Intervals for the Difference Between Two Population Means
Section 10.1 Exercises
10.2 Confidence Intervals for the Difference Between Two Means: Paired Samples
Construct Confidence Intervals with Paired Samples
Section 10.2 Exercises
10.3 Confidence Intervals for the Difference Between Two Proportions
Construct Confidence Intervals for the Difference Between Two Proportions
Section 10.3 Exercises
Chapter 10 Summary
Vocabulary and Notation
Important Formulas
Chapter Quiz
Review Exercises
Write About It
Activities
Case Study: Evaluating The Assignment of Subjects In a Clinical Trial
Chapter 11: Two-Sample Hypothesis Tests
Chapter 11 Introduction
Introduction
11.1 Hypothesis Tests for the Difference Between Two Means: Independent Samples
Perform a Hypothesis Test for the Difference Between Two Means Using the P-Value Method
Performing Hypothesis Tests Using the Critical Value Method
Section 11.1 Exercises
11.2 Hypothesis Tests for the Difference Between Two Means: Paired Samples
Hypothesis Tests with Matched Pairs Using the P-Value Method
Testing a Hypothesis with Matched-Pair Data Using the Critical Value Method
Section 11.2 Exercises
11.3 Hypothesis Tests for the Difference Between Two Proportions
Perform a Hypothesis Test for the Difference Between Two Proportions Using the P-Value Method
Using the Critical Value Method
Section 11.3 Exercises
11.4 Hypothesis Tests for Two Population Standard Deviations
Find Critical Values of the F Distribution
Perform a Hypothesis Test for Two Population Standard Deviations
Section 11.4 Exercises
11.5 The Multiple Testing Problem
The Multiple Testing Problem
The Bonferroni Method
Report all P-values
Section 11.5 Exercises
Chapter 11 Summary
Vocabulary and Notation
Important Formulas
Chapter Quiz
Review Exercises
Write About It
Activities
Case Study: Does Exposure to Electrical Fields Cause Brain Cancer?
People also search for Elementary Statistics 4th Edition:
aila navidi
sam navidi
elementary statistics navidi pdf
neda navidi
hat sandra navidi kinder
You may also like…
Mathematics - Mathematical Statistics
Statistics for Engineers and Scientists, 6th Edition by William Navidi 1266115838 9781266115837
Uncategorized
Business & Economics
Science (General)
Business & Economics - Sales & Marketing
Marketing Management 4th editon by Greg Marshall ISBN 1264155417 9781264155415
Computers - Applications & Software
Uncategorized
Mathematics - Mathematical Statistics


