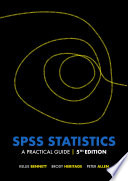
SPSS Statistics A Practical Guide 5th Edition by Kellie Bennett, Dr Brody Heritage, Dr Peter Allen ISBN 9780170460163 0170460169
$50.00 Original price was: $50.00.$25.00Current price is: $25.00.
SPSS Statistics A Practical Guide 5th Edition by Kellie Bennett, Dr Brody Heritage, Dr Peter Allen – Ebook PDF Instant Download/Delivery: 9780170460163 ,0170460169
Full download SPSS Statistics A Practical Guide 5th Edition after payment
Product details:
ISBN 10: 0170460169
ISBN 13: 9780170460163
Author: Kellie Bennett, Dr Brody Heritage, Dr Peter Allen
SPSS Statistics A Practical Guide 5th Edition Table of contents:
Chapter 1: Getting Started With SPSS Statistics
1.1. Introduction
1.1.1. Data View
1.1.2. Variable View
1.2. Creating a Data File
1.3. Conclusion
Chapter 2: Working With Data
2.1. Introduction
2.2. Compute
2.2.1. Illustrated Example of Summed Scale Scores
2.3. Recode
2.3.1. Illustrated Example of Category Recoding
2.4. Missing Value Analysis
2.4.1. Illustrated Example of Missing Age Data Replacement
2.5. Split File
2.5.1. Illustrated Example of Splitting Output by Gender
2.6. Select Cases
2.6.1. Illustrated Example of Selecting Cases Above a Specified Age
2.7. Conclusion
Chapter 3: Summarising and Displaying Data
3.1. Introduction
3.2. Frequencies
3.2.1. Illustrated Example of Frequencies
3.2.1.1. SPSS Statistics Procedure
3.2.1.2. SPSS Statistics Output
3.2.1.3. The SPSS Statistics Viewer
3.3. Descriptives
3.3.1. Illustrated Example of Descriptives
3.3.1.1. SPSS Statistics Procedure
3.3.1.2. SPSS Statistics Output
3.4. Explore
3.4.1. Illustrated Example of Explore
3.4.1.1. SPSS Statistics Procedure
3.4.1.2. SPSS Statistics Output
3.4.1.3. The SPSS Statistics Chart Editor
3.5. Chart Builder
3.5.1. Illustrated Example of the Chart Builder
3.6. Conclusion
Chapter 4: One Sample t Test
4.1. Purpose of the One Sample t Test
4.2. Questions We Could Answer Using the One Sample t Test
4.3. Illustrated Example of a Statistically Signficiant One Sample t Test
4.3.1. Setting Up the SPSS Statistics Data File
4.3.2. Analysing the Data
4.3.2.1. Assumptions
4.3.2.2. SPSS Statistics Procedure (Part 1: Normality)
4.3.2.3. SPSS Statistics Output (Part 1: Normality)
4.3.2.4. SPSS Statistics Procedure (Part 2: One Sample t Test)
4.3.2.5. SPSS Statistics Output (Part 2: One Sample t Test)
4.3.3. Follow Up Analyses
4.3.3.1. Effect Size
4.3.4. APA Style Results Write-Up
4.3.5. Summary
4.4. Illustrated Example of a Statistically Non-Signficiant One Sample t Test
4.4.1. SPSS Statistics Output (Part 1: Normality)
4.4.2. SPSS Statistics Output (Part 2: One Sample t Test)
4.4.3. Follow Up Analyses
4.4.3.1. Effect Size
4.4.4. APA Style Results Write-Up
4.5. One Sample t Test Checklist
Chapter 5: Independent Samples t Test
5.1. Purpose of the Independent Samples t Test
5.2. Questions We Could Answer Using the Independent Samples t Test
5.3. Illustrated Example of a Statistically Significant Independent Samples t Test
5.3.1. Setting Up the SPSS Statistics Data File
5.3.2. Analysing the Data
5.3.2.1. Assumptions
5.3.2.2. SPSS Statistics Procedure (Part 1: Normality)
5.3.2.3. SPSS Statistics Output (Part 1: Normality)
5.3.2.4. SPSS Statistics Procedure (Part 2: Homogeneity of Variance & the t Test)
5.3.2.5. SPSS Statistics Output (Part 2: Homogeneity of Variance & the t Test)
5.3.3. Follow Up Analyses
5.3.3.1. Effect Size
5.3.4. APA Style Results Write-Up
5.3.5. Summary
5.4. Illustrated Example of a Statistically Non-Significant Independent Samples t Test
5.4.1. SPSS Statistics Output (Part 1: Normality)
5.4.2. SPSS Statistics Output (Part 2: Homogeneity of Variance & the t Test)
5.4.3. Follow Up Analyses
5.4.3.1. Effect Size
5.4.4. APA Style Results Write-Up
5.5. Bayesian Independent Sample Inference
5.5.1. Analysing the Data
5.5.2. SPSS Statistics Output
5.5.3. APA Style Results Write-Up
5.6. Independent Samples t Test Checklist
Chapter 6: Paired Samples t Test
6.1. Purpose of the Paired Samples t Test
6.2. Questions We Could Answer Using the Paired Samples t Test
6.3. Illustrated Example of a Statistically Signficant Paired Samples t Test
6.3.1. Setting Up the SPSS Statistics Data File
6.3.2. Analysing the Data
6.3.2.1. Assumptions
6.3.2.2. SPSS Statistics Procedure (Part 1: Normality & Normality of Difference Scores)
6.3.2.3. SPSS Statistics Output (Part 1: Normality & Normality of Difference Scores)
6.3.2.4. SPSS Statistics Procedure (Part 2: Paired Samples t Test)
6.3.2.5. SPSS Statistics Output (Part 2: Paired Samples t Test)
6.3.3. Follow Up Analyses
6.3.3.1. Effect Size
6.3.4. APA Style Results Write-Up
6.3.5. Summary
6.4. Illustrated Example of a Statistically Non-Signficant Paired Samples t Test
6.4.1. SPSS Statistics Output (Part 1: Normality & Normality of Difference Scores)
6.4.2. SPSS Statistics Output (Part 2: Paired Samples t Test)
6.4.3. Follow Up Analyses
6.4.3.1. Effect Size
6.4.3.2. SPSS Statistics Procedure (Power)
6.4.3.3. SPSS Statistics Output (Power)
6.4.3.4. SPSS Statistics Procedure (Sample Size)
6.4.3.5. SPSS Statistics Output (Sample Size)
6.4.4. APA Style Results Write-Up
6.5. Paired Samples t Test Checklist
Chapter 7: One-Way Between Groups ANOVA
7.1. Purpose of the One-Way Between Groups ANOVA
7.2. Questions We Could Answer Using the One-Way Between Groups ANOVA
7.3. Illustrated Example of a Statistically Significant One-Way Between Groups ANOVA
7.3.1. Setting Up the SPSS Statistics Data File
7.3.2. Analysing the Data
7.3.2.1. Assumptions
7.3.2.2. SPSS Statistics Procedure (Part 1: Normality)
7.3.2.3. SPSS Statistics Output (Part 1: Normality)
7.3.2.4. SPSS Statistics Procedure (Part 2: Homogeneity of Variance & the ANOVA)
7.3.2.5. SPSS Statistics Output (Part 2: Homogeneity of Variance & the ANOVA)
7.3.3. Follow Up Analyses
7.3.3.1. Effect Size
7.3.3.1.1. Effect Size Calculations for the Omnibus ANOVA
7.3.3.1.2. Effect Size Calculations for the Contrasts and Comparisons
7.3.4. APA Style Results Write-Up
7.3.5. Summary
7.4. Illustrated Example of a Statistically Non-Significant One-Way Between Groups ANOVA
7.4.1. SPSS Statistics Output (Part 1: Normality)
7.4.2. SPSS Statistics Output (Part 2: Homogeneity of Variance & the ANOVA)
7.4.3. Follow Up Analyses
7.4.3.1. Effect Size
7.4.4. APA Style Results Write-Up
7.5. One-Way Between Groups ANOVA Checklist
Chapter 8: Factorial Between Groups ANOVA
8.1. Purpose of the Factorial Between Groups ANOVA
8.2. Questions We Could Answer Using the Factorial Between Groups ANOVA
8.3. Illustrated Example of a Factorial ANOVA with a Significant Interaction
8.3.1. Setting Up the SPSS Statistics Data File
8.3.2. Analysing the Data
8.3.2.1. Assumptions
8.3.2.2. SPSS Statistics Procedure (Part 1: Normality)
8.3.2.3. SPSS Statistics Output (Part 1: Normality)
8.3.2.4. SPSS Statistics Procedure (Part 2: Homogeneity of Variance and the ANOVA)
8.3.2.5. SPSS Statistics Output (Part 2: Homogeneity of Variance and the ANOVA)
8.3.3. Follow-Up Analyses
8.3.3.1. Simple Effects and Comparisons
8.3.3.2. Effect Size (Omega-Squared)
8.3.4. APA Style Results Write-Up
8.4. Illustrated Example of a Factorial ANOVA with a Non-Significant Interaction
8.4.1. SPSS Statistics Output
8.4.2. APA Style Results Write-Up
8.5. Conclusion
8.6. Factorial Between Groups ANOVA Checklist
Chapter 9: One-Way Repeated Measures ANOVA and Mixed Model ANOVA
9.1. Introduction
9.2. One-Way Repeated Measures ANOVA
9.3. Questions We Could Answer Using the One-Way Repeated Measures ANOVA
9.4. Illustrated Example of a One-Way Repeated Measures ANOVA
9.4.1. Setting Up The SPSS Statistics Data File
9.4.2. Analysing the Data
9.4.2.1. Assumptions
9.4.2.2. SPSS Statistics Procedure (Part 1: Normality)
9.4.2.3. SPSS Statistics Output (Part 1: Normality)
9.4.2.4. SPSS Statistics Procedure (Part 2: Homogeneity of Variance, Sphericity, & the ANOVA)
9.4.2.5. SPSS Statistics Output (Part 2: Homogeneity of Variance, Sphericity, & the ANOVA)
9.4.3. APA Style Results Write-Up
9.5. Mixed Model ANOVA
9.6. Questions We Could Answer Using the Mixed Model ANOVA
9.7. Illustrated Example of a Mixed Model ANOVA
9.7.1. Setting Up The SPSS Statistics Data File
9.7.2. Analysing the Data
9.7.2.1. SPSS Statistics Procedure (Homogeneity of Variance, Sphericity, Homogeneity of Covariance Matrices & the Mixed Model ANOVA)
9.7.2.2. SPSS Statistics Output (Homogeneity of Variance, Sphericity, Homogeneity of Covariance Matrices & the Mixed Model ANOVA)
9.7.3. APA Style Results Write-Up
9.8. One-Way Repeated Measures and Mixed Model ANOVA Checklist
Chapter 10: One-Way Analysis of Covariance (ANCOVA)
10.1. Purpose of the One-Way ANCOVA
10.2. Questions We Could Answer Using the One-Way ANCOVA
10.3. Illustrated Example of a Statistically Significant One-Way ANCOVA
10.3.1. Setting Up the SPSS Statistics Data File
10.3.2. Analysing the Data
10.3.2.1. Assumptions
10.3.2.2. SPSS Statistics Procedure (Part 1: Normality)
10.3.2.3. SPSS Statistics Output (Part 1: Normality)
10.3.2.4. SPSS Statistics Procedure (Part 2: Homogeneity of Regression Slopes)
10.3.2.5. SPSS Statistics Output (Part 2: Homogeneity of Regression Slopes)
10.3.2.6. SPSS Statistics Procedure (Part 3: Linearity)
10.3.2.7. SPSS Statistics Output (Part 3: Linearity)
10.3.2.8. SPSS Statistics Procedure (Part 4: Homogeneity of Variance & the ANCOVA)
10.3.2.9. SPSS Statistics Output (Part 4: Homogeneity of Variance & the ANCOVA)
10.3.3. APA Style Results Write-Up
10.3.4. Summary
10.4. Illustrated Example of a Statistically Non-Significant One-Way ANCOVA
10.4.1. SPSS Statistics Output (Part 1: Normality)
10.4.2. SPSS Statistics Output (Part 2: Homogeneity of Regression Slopes)
10.4.3. SPSS Statistics Output (Part 3: Linearity)
10.4.4. SPSS Statistics Output (Part 4: Homogeneity of Variance & the ANCOVA)
10.4.5. APA Style Results Write-Up
10.5. One-Way ANCOVA Checklist
Chapter 11: Multivariate Analysis of Variance (MANOVA)
11.1. Purpose of the MANOVA
11.2. Questions We Could Answer Using the MANOVA
11.3. Illustrated Example of a Statistcally Significant MANOVA
11.3.1. Setting Up the SPSS Statistics Data File
11.3.2. Analysing the Data
11.3.2.1. Assumptions
11.3.2.2. SPSS Statistics Procedure (Part 1: Univariate Normality)
11.3.2.3. SPSS Statistics Output (Part 1: Univariate Normality)
11.3.2.4. SPSS Statistics Procedure (Part 2: Multicollinearity and Multivariate Outliers)
11.3.2.5. SPSS Statistics Output (Part 2: Multicollinearity and Multivariate Outliers)
11.3.2.6. SPSS Statistics Procedure (Part 3: Linearity)
11.3.2.7. SPSS Statistics Output (Part 3: Linearity)
11.3.2.8. SPSS Advanced Statistics Procedure (Part 4: Homogeneity of Variance-Covariance and the MANOVA)
11.3.2.9. SPSS Advanced Statistics Output (Part 4: Homogeneity of Variance-Covariance and the MANOVA)
11.3.3. APA Style Results Write-Up
11.3.4. Summary
11.4. Illustrated Example of a Statistcally Non-Significant MANOVA
11.4.1. SPSS Statistics Output (Part 1: Univariate Normality)
11.4.2. SPSS Statistics Output (Part 2: Multicollinearity and Multivariate Outliers)
11.4.3. SPSS Statistics Output (Part 3: Linearity)
11.4.4. SPSS Advanced Statistics Output (Part 4: Homogeneity of Variance-Covariance and the MANOVA)
11.4.5. APA Style Results Write-Up
11.5. MANOVA Checklist
Chapter 12: Correlation
12.1. Purpose of Correlation
12.2. Questions We Could Answer Using Correlation
12.3. Illustrated Example of a Bivariate Correlation
12.3.1. Setting Up the SPSS Statistics Data File
12.3.2. Analysing the Data
12.3.2.1. Assumptions
12.3.2.2. SPSS Statistics Procedure (Part 1: Normality)
12.3.2.3. SPSS Statistics Output (Part 1: Normality)
12.3.2.4. SPSS Statistics Procedure (Part 2: Linearity and Homoscedasticity)
12.3.2.5. SPSS Statistics Output (Part 2: Linearity and Homoscedasticity)
12.3.2.6. SPSS Statistics Procedure (Part 3: Correlation)
12.3.2.7. SPSS Statistics Output (Part 3: Correlation)
12.3.3. Follow-Up Analyses
12.3.3.1. Effect Size
12.3.4. APA Style Results Write-Up
12.3.5. Summary
12.4. Illustrated Example of a Partial Correlation
12.4.1. SPSS Statistics Procedure
12.4.2. SPSS Statistics Output
12.4.3. APA Style Results Write-Up
12.5. Correlation Checklist
Chapter 13: Multiple Regression
13.1. Purpose of Multiple Regression
13.2. Questions We Could Answer Using Multiple Regression
13.3. Illustrated Example of a Linear Multiple Regression
13.3.1. Setting Up the SPSS Statistics Data File
13.3.2. Analysing the Data
13.3.2.1. Assumptions
13.3.2.2. SPSS Statistics Procedure (Part 1: Normality and Univariate Outliers)
13.3.2.3. SPSS Statistics Output (Part 1: Normality and Univariate Outliers)
13.3.2.4. SPSS Statistics Procedure (Part 2: The Remaining Assumptions and the Linear Multiple Regression)
13.3.2.5. SPSS Statistics Output (Part 2: The Remaining Assumptions and the Linear Multiple Regression)
13.3.3. Follow-Up Analyses
13.3.3.1. Effect Size
13.3.4. APA Style Results Write-Up
13.3.5. Summary
13.4. Illustrated Example of a Hierarchical Multiple Regression
13.4.1. Setting Up the SPSS Statistics Data File
13.4.2. Analysing the Data
13.4.2.1. Assumptions
13.4.2.2. SPSS Statistics Procedure
13.4.2.3. SPSS Statistics Output
13.4.3. Follow-Up Analyses
13.4.3.1. Effect Size
13.4.4. APA Style Results Write-Up
13.5. Purpose of Mediation and Moderation
13.6. Illustrated Examples of Mediation and Moderation
13.6.1. Analysing the Data
13.6.1.1. SPSS Statistics Procedure (Part 1: Mediation)
13.6.1.2. SPSS Statistics Output
13.6.1.3. SPSS Statistics Procedure (Part 2: Moderation)
13.6.1.4. SPSS Statistics Output
13.6.1.5. SPSS Statistics Procedure (Part 3: Probing a Moderation via Simple Slopes)
13.6.1.6. SPSS Statistics Output
13.6.2. APA Style Results Write-Up
13.7. Multiple Regression Checklist
Chapter 14: Logistic Regression
14.1. Purpose of Logistic Regression
14.2. Questions We Could Answer Using Logistic Regression
14.3. Illustrated Example of Binary Logistic Regression
14.3.1. Setting Up the SPSS Statistics Data File
14.3.2. Analysing the Data
14.3.2.1. Assumptions
14.3.2.2. SPSS Statistics Procedure (Part 1: Multicollinearity)
14.3.2.3. SPSS Statistics Output (Part 1: Multicollinearity)
14.3.2.4. SPSS Statistics Procedure (Part 2: Logit Linearity)
14.3.2.5. SPSS Statistics Output (Part 2: Logit Linearity)
14.3.2.6. SPSS Statistics Procedure (Part 3: Logistic Regression and Outliers)
14.3.2.7. SPSS Statistics Output (Part 3: Logistic Regression and Outliers)
14.3.3. APA Style Results Write-Up
14.3.4. Summary
14.4. Logistic Regression Checklist
Chapter 15: Factor Analysis
15.1. Purpose of a Factor Analysis
15.2. Questions We Could Answer Using a Factor Analysis
15.3. Illustrated Example of Analysing the Factors Underlying a Smoking Questionnaire
15.3.1. Setting Up the SPSS Statistics Data File
15.3.2. Analysing the Data
15.3.2.1. Assumptions
15.3.2.2. SPSS Statistics Procedure (Part 1: Normality)
15.3.2.3. SPSS Statistics Output (Part 1: Normality)
15.3.2.4. SPSS Statistics Procedure (Part 2: Factor Analysis)
15.3.2.5. SPSS Statistics Output (Part 2: Factor Analysis)
15.3.3. APA Style Results Write-Up
15.3.4. Summary
15.4. Factor Analysis Checklist
Chapter 16: Reliability Analysis
16.1. Introduction
16.2. Cronbach’s Alpha
16.2.1. Illustrated Example of the Reliability of Personality Domain Scores
16.2.1.1. Setting Up the SPSS Statistics Data File
16.2.1.2. SPSS Statistics Procedure (Reversing Negatively Scaled Items)
16.2.1.3. SPSS Statistics Procedure (Cronbach’s Alpha)
16.2.1.4. SPSS Statistics Output
16.2.1.5. APA Style Results Write-Up
16.3. Cohen’s Kappa
16.3.1. Illustrated Example Two of Reliability Between Two Raters
16.3.1.1. Setting Up the SPSS Statistics Data File
16.3.1.2. SPSS Statistics Procedure
16.3.1.3. SPSS Statistics Output
16.3.1.4. APA Style Results Write-Up
16.4. Reliability Analysis Checklist
Chapter17: Non-Parametric Procedures
17.1. Introduction
17.2. Chi-Square (c2) Test for Goodness of Fit
17.3. Chi-Square (c2) Test of Contingencies
17.4. Mann-Whitney U Test
17.5. McNemar Test of Change
17.6.Wilcoxon Signed Rank Test
17.7. Kruskal-Wallis One-Way ANOVA
17.8. Cochran’s Q Test
17.9. Friedman ANOVA
17.10. Cramer’s V
17.11. Spearman’s Rho and Kendall’s Tau-B
17.12. Non-Parametric Checklist
Chapter 18: Working with Syntax
18.1. Purpose of Working with Syntax
18.2. Using Syntax to Conduct an Independent Samples t Test
18.2.1. Generating Syntax to Test the Normality Assumption
18.2.2. Command Syntax for Testing the Normality Assumption
18.2.3. Generating Syntax for Assessing Homogeneity of Variance and Running the t Test
18.2.4. Command Syntax for Assessing Homogeneity of Variance and Running the t Test
18.3. Summary
Referencees
People also search for SPSS Statistics A Practical Guide 5th Edition:
spss statistics a practical guide pdf
spss statistics a practical guide 4th edition
spss statistics a practical guide 4th edition pdf
spss statistics a practical guide 4th ed
spss statistics version 22 a practical guide
Tags:
Kellie Bennett,Dr Brody Heritage,Dr Peter Allen,SPSS Statistics,Practical Guide
You may also like…
Uncategorized
Mathematics - Mathematical Statistics
Medicine - Dermatology
Biology and other natural sciences Biostatistics
Basic Statistics and Epidemiology: A Practical Guide 5th Edition Antony Stewart
Medicine - Dermatology
Computers - Applications & Software
A Conceptual Guide to Statistics Using SPSS 1st Edition Elliot T Berkman Steven P Reise
Medicine
Statistics for Laboratory Scientists and Clinicians A Practical Guide 1st Edition Mcdonnell Sill


