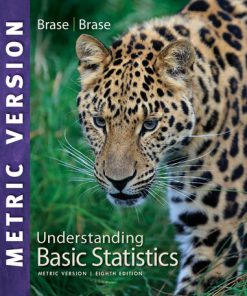
Understandable Statistics Concepts and Methods 12th Edition by Charles Brase 1337119911 9781337119917
$50.00 Original price was: $50.00.$25.00Current price is: $25.00.
Understandable Statistics Concepts and Methods 12th Edition by Charles Brase – Ebook PDF Instant Download/Delivery: 1337119911, 9781337119917
Full download Understandable Statistics Concepts and Methods 12th Edition after payment
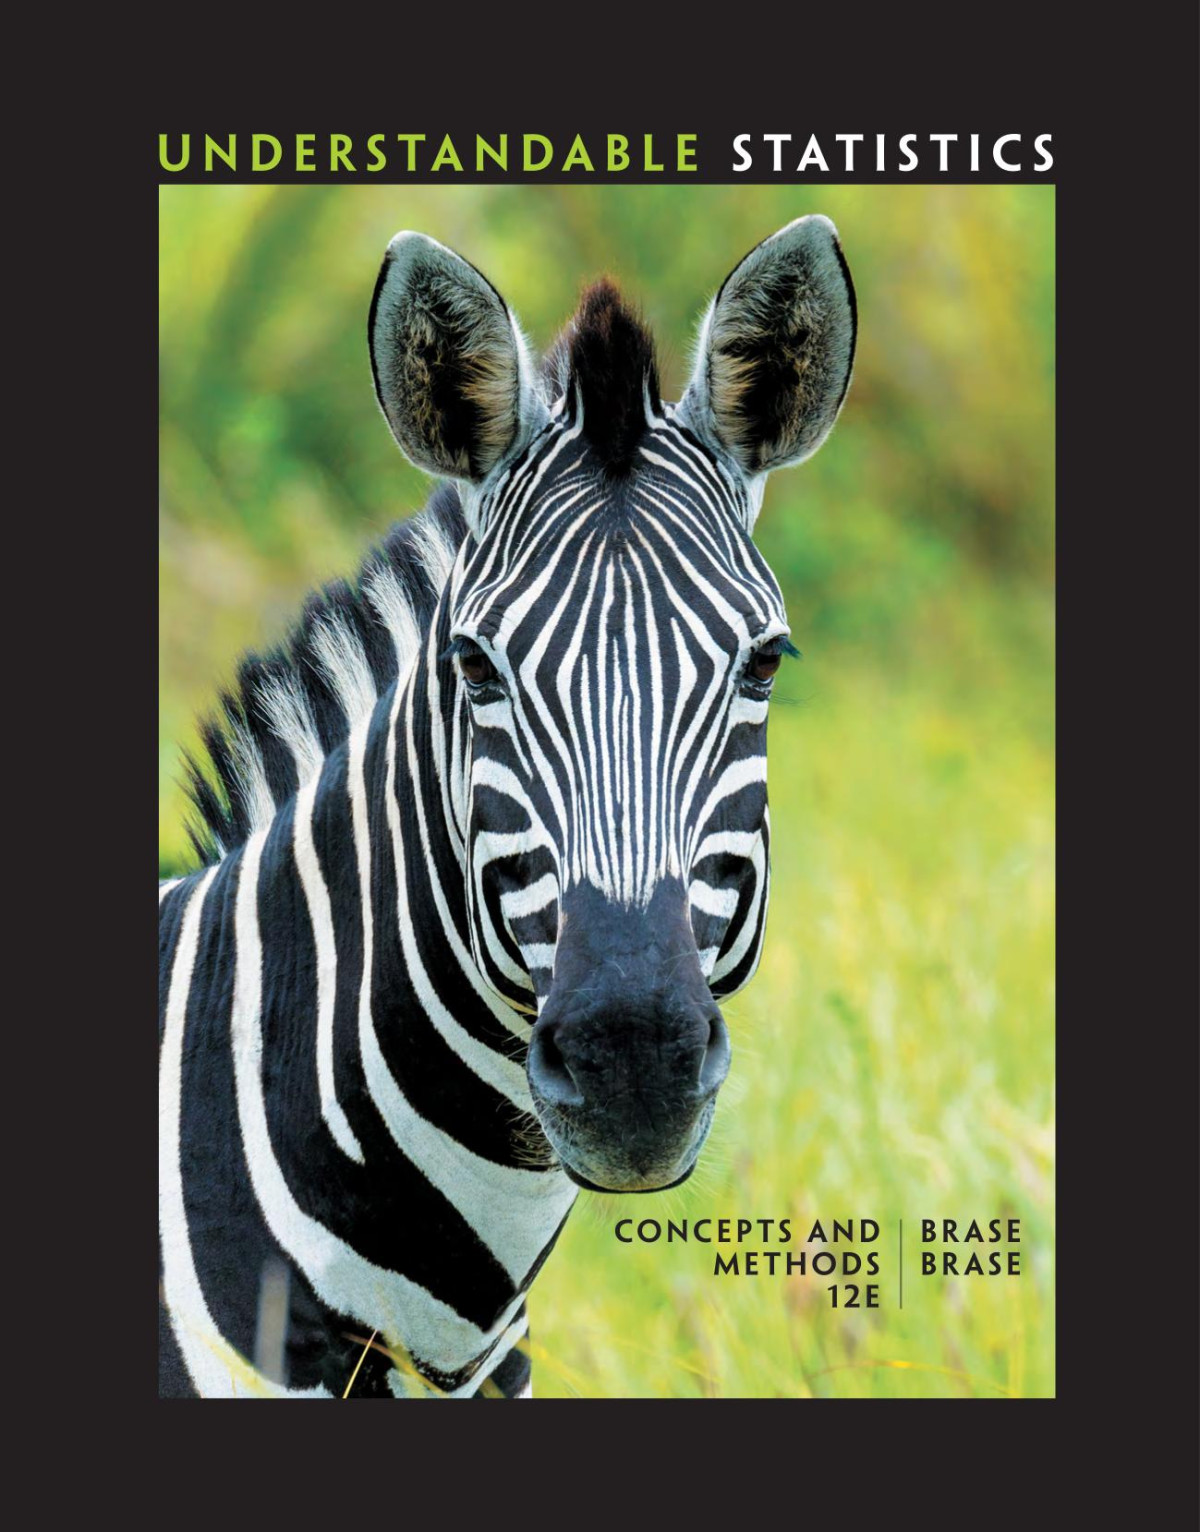
Product details:
ISBN 10: 1337119911
ISBN 13: 9781337119917
Author: Charles Brase
UNDERSTANDABLE STATISTICS: CONCEPTS AND METHODS, Twelfth Edition, is thorough, accessible, and designed to help you overcome “statistics anxiety” and master the subject. Clear guidance and informal advice help show you the links between statistics and the real world. Making the material interesting as well as easier to understand, the book integrates real-life data from a variety of sources, including journals, newspapers, and the Internet. Special features and exercises throughout the text let you develop your critical-thinking and statistical literacy skills, and interactive online resources offer you extra study assistance and tutorial support—including step-by-step video solutions—outside of class. The use of graphing calculators, Excel®, Minitab®, Minitab Express™, and SPSS® is covered, although not required.
Understandable Statistics Concepts and Methods 12th Table of contents:
1. Getting Started
Section 1.1. What Is Statistics?
Introduction
Levels of Measurement: Nominal, Ordinal, Interval, Ratio
Section 1.1. Problems
Section 1.2. Random Samples
Simple Random Samples
Other Sampling Techniques
Section 1.2. Problems
Section 1.3. Introduction to Experimental Design
Planning a Statistical Study
Experiments and Observation
Surveys
Choosing Data Collection Techniques
Section 1.3. Problems
Summary
Important Words & Symbols
Chapter Review Problems
Data Highlights: Group Projects
Linking Concepts: Writing Projects
Using Technology
2. Organizing Data
Section 2.1. Frequency Distributions, Histograms, and Related Topics
Frequency Tables
Histograms and Relative-Frequency Histograms
Distribution Shapes
Cumulative-Frequency Tables and Ogives
Section 2.1. Problems
Section 2.2. Bar Graphs, Circle Graphs, and Time-Series Graphs
Section 2.2. Problems
Section 2.3. Stem-and-Leaf Displays
Exploratory Data Analysis
Stem-and-Leaf Display
Section 2.3. Problems
Summary
Important Words & Symbols
Chapter Review Problems
Data Highlights: Group Projects
Linking Concepts: Writing Projects
Using Technology
3. Averages and Variation
Section 3.1. Measures of Central Tendency: Mode, Median, and Mean
Weighted Average
Section 3.1. Problems
Section 3.2. Measures of Variation
Variance and Standard Deviation
Coefficient of Variation
Chebyshev’s Theorem
Section 3.2. Problems
Section 3.3. Percentiles and Box-and-Whisker Plots
Box-and-Whisker Plots
Section 3.3. Problems
Summary
Important Words & Symbols
Chapter Review Problems
Data Highlights: Group Projects
Linking Concepts: Writing Projects
Using Technology
Chapter 1-3. Cumulative Review Problems
4. Elementary Probability Theory
Section 4.1. What Is Probability?
Interpreting Probabilities
Probability Related to Statistics
Section 4.1. Problems
Section 4.2. Some Probability Rules—Compound Events
Conditional Probability and Multiplication Rules
Addition Rules
Further Examples Using Contingency Tables
Section 4.2. Problems
Section 4.3. Trees and Counting Techniques
Section 4.3. Problems
Summary
Important Words & Symbols
Chapter Review Problems
Data Highlights: Group Projects
Linking Concepts: Writing Projects
Using Technology
5. The Binomial Probability Distribution and Related Topics
Section 5.1. Introduction to Random Variables and Probability Distributions
Random Variables
Probability Distribution of a Discrete Random Variable
Linear Functions of a Random Variable
Linear Combinations of Independent Random Variables
Section 5.1. Problems
Section 5.2. Binomial Probabilities
Binomial Experiment
Computing Probabilities for a Binomial Experiment Using the Binomial Distribution Formula
Using a Binomial Distribution Table
Using Technology to Compute Binomial Probabilities
Sampling Without Replacement: Use of the Hypergeometric Probability Distribution
Section 5.2. Problems
Section 5.3. Additional Properties of the Binomial Distribution
Graphing a Binomial Distribution
Mean and Standard Deviation of a Binomial Distribution
Quota Problems: Minimum Number of Trials for a Given Probability
Section 5.3. Problems
Section 5.4. The Geometric and Poisson Probability Distributions
Geometric Distribution
Poisson Probability Distribution
Poisson Approximation to the Binomial Probability Distribution
Summary
Section 5.4. Problems
Summary
Important Words & Symbols
Chapter Review Problems
Data Highlights: Group Projects
Linking Concepts: Writing Projects
Using Technology
6. Normal Curves and Sampling Distributions
Part 1 Normal Distributions
Section 6.1. Graphs of Normal Probability Distributions
Control Charts
Section 6.1. Problems
Section 6.2. Standard Units and Areas under the Standard Normal Distribution
z Scores and Raw Scores
Standard Normal Distribution
Areas Under the Standard Normal Curve
Using a Standard Normal Distribution Table
Section 6.2. Problems
Section 6.3. Areas Under Any Normal Curve
Normal Distribution Areas
Inverse Normal Distribution
Section 6.3. Problems
Part I Summary
Part II: Sampling Distributions and the Normal Approximation to Binomial Distribution
Section 6.4. Sampling Distributions
Section 6.4. Problems
Section 6.5. The Central Limit Theorem
The x ¯ Distribution, Given x Is Normal
The x ¯ Distribution, Given x Follows Any Distribution
Section 6.5. Problems
Section 6.6. Normal Approximation to Binomial Distribution and to p ^ Distribution
Sampling Distributions for Proportions
Section 6.6. Problems
Part II Summary
Summary
Important Words & Symbols
Chapter Review Problems
Data Highlights: Group Projects
Linking Concepts: Writing Projects
Using Technology
Chapters 4-6. Cumulative Review Problems
7. Estimation
Part I Estimating a Single Mean or Single Proportion
Section 7.1. Estimating μ When σ Is Known
Sample Size for Estimating the Mean μ
Section 7.1. Problems
Section 7.2. Estimating μ When σ Is Unknown
Student’s t Distributions
Using Table 6 to Find Critical Values for Confidence Intervals
Confidence Intervals for μ When σ Is Unknown
Section 7.2. Problems
Section 7.3. Estimating p in the Binomial Distribution
Interpreting Results from a Poll
Sample Size for Estimating p
Section 7.3. Problems
Part I Summary
Part II Estimating the Difference Between Two Means or Two Proportions
Section 7.4. Estimating μ 1 – μ 2 and p 1 – p 2
Independent Samples and Dependent Samples
Confidence Intervals for μ 1 – μ 2 ( σ 1 and σ 2 Known)
Confidence Intervals for μ 1 – μ 2 When σ 1 and σ 2 Are Unknown
Estimating the Difference of Proportions p 1 – p 2
Section 7.4. Problems
Part II Summary
Summary
Important Words & Symbols
Chapter Review Problems
Data Highlights: Group Projects
Linking Concepts: Writing Projects
Using Technology
8. Hypothesis Testing
Part I Testing a Single Mean or Single Proportion
Section 8.1. Introduction to Statistical Tests
Stating Hypotheses
Types of Tests
Hypothesis Tests of μ , Given x Is Normal and σ Is Known
The P -Value of a Statistical Test
Types of Errors
Concluding a Statistical Test
Section 8.1. Problems
Section 8.2. Testing the Mean μ
Part A: Testing μ When σ Is Known
Part B: Testing μ When σ Is Unknown
Part C: Testing μ Using Critical Regions (Traditional Method)
Section 8.2. Problems
Section 8.3. Testing a Proportion p
Section 8.3. Problems
Part I Summary
Part II Testing a Difference Between Two Means or Two Proportions
Section 8.4. Tests Involving Paired Differences (Dependent Samples)
Paired Data
Section 8.4. Problems
Section 8.5. Testing μ 1 – μ 2 and p 1 – p 2 (Independent Samples)
Independent Samples
Part A: Testing μ 1 – μ 2 When σ 1 and σ 2 Are Known
Part B: Testing μ 1 – μ 2 When σ 1 and σ 2 Are Unknown
Part C: Testing a Difference of Proportions p 1 – p 2
Part D: Testing μ 1 – μ 2 and p 1 – p 2 Using Critical Regions
Section 8.5. Problems
Part II Summary
Summary
Finding the P -Value Corresponding to a Sample Test Statistic
Important Words & Symbols
Chapter Review Problems
Data Highlights: Group Projects
Linking Concepts: Writing Projects
Using Technology
9. Correlation and Regression
Part I Simple Linear Regression
Section 9.1. Scatter Diagrams and Linear Correlation
Sample Correlation Coefficient r
Development of Formula for r
Computation Formula for r
Section 9.1. Problems
Section 9.2. Linear Regression and the Coefficient of Determination
Coefficient of Determination
Section 9.2. Problems
Section 9.3. Inferences for Correlation and Regression
Testing the Correlation Coefficient
Standard Error of Estimate
Confidence Intervals for y
Inferences about the Slope β
Computation Hints for Sample Test Statistic t Used in Testing ρ and Testing β
Section 9.3. Problems
Part I: Summary
Part II Multiple Regression
Section 9.4. Multiple Regression
Advantages of Multiple Regression
Basic Terminology and Notation
Regression Models and Computers
Example Utilizing Minitab
Testing a Coefficient for Significance
Confidence Intervals for Coefficients
Excel 2013 Displays
Section 9.4. Problems
Part II: Summary
Summary
Important Words & Symbols
Chapter Review Problems
Data Highlights: Group Projects
Linking Concepts: Writing Projects
Using Technology
Chapters 7-9. Cumulative Review Problems
10. Chi-Square and F Distributions
Part I Inferences Using the Chi-Square Distribution
Overview of the Chi-Square Distribution
Section 10.1. Chi-Square: Tests of Independence and of Homogeneity
Tests of Homogeneity
Multinomial Experiments (Optional Reading)
Section 10.1. Problems
Section 10.2. Chi-Square: Goodness of Fit
Section 10.2. Problems
Section 10.3. Testing and Estimating a Single Variance or Standard Deviation
Testing σ 2
Confidence Interval for σ 2
Section 10.3. Problems
Part I Summary
Part II Inferences Using the F Distribution
Overview of the F Distribution
Section 10.4. Testing Two Variances
How to Set up the Test
Section 10.4. Problems
Section 10.5. One-Way ANOVA: Comparing Several Sample Means
Section 10.5. Problems
Section 10.6. Introduction to Two-Way ANOVA
Procedure to Conduct a Two-Way ANOVA Test (More Than One Measurement per Cell)
Special Case: One Observation in Each Cell with No Interaction
Experimental Design
Section 10.6. Problems
Part II: Summary
Summary
Important Words & Symbols
Chapter Review Problems
Data Highlights: Group Projects
Linking Concepts: Writing Projects
Using Technology
11. Nonparametric Statistics
Section 11.1. The Sign Test for Matched Pairs
Section 11.1. Problems
Section 11.2. The Rank-Sum Test
Section 11.2. Problems
Section 11.3. Spearman Rank Correlation
Section 11.3. Problems
Section 11.4. Runs Test for Randomness
Section 11.4. Problems
Summary
Important Words & Symbols
Chapter Review Problems
Data Highlights: Group Projects
Linking Concepts: Writing Projects
Chapter 10-11. Cumulative Review Problems
People also search for Understandable Statistics Concepts and Methods 12th:
basic concepts statistics
understandable statistics 12th edition free
basic statistics courses
basic research and basic statistics
Tags:
Charles Brase,Understandable,Statistics,Concepts
You may also like…
Romance - Contemporary Romance
Business & Economics - Management & Leadership
Contemporary Management, 12th ed. 12th Edition Gareth R. Jones
Mathematics - Mathematical Statistics
Jurisprudence & Law - General & Miscellaneous Law
Mathematics - Mathematical Statistics
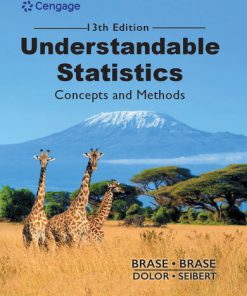
Understandable Statistics. Concepts and Methods 13th Edition by Charles Henry Brase 9798214119830
Mathematics - Mathematical Statistics
Business & Economics - Econometrics
Probability and Statistics for Economists 12th Edition Bruce Hansen
Travel - Europe - Travel
Politics & Philosophy - Anthropology
Trajectories Excursions with the Anthropology of E Douglas Lewis Julian C.H. Lee (Editor)


