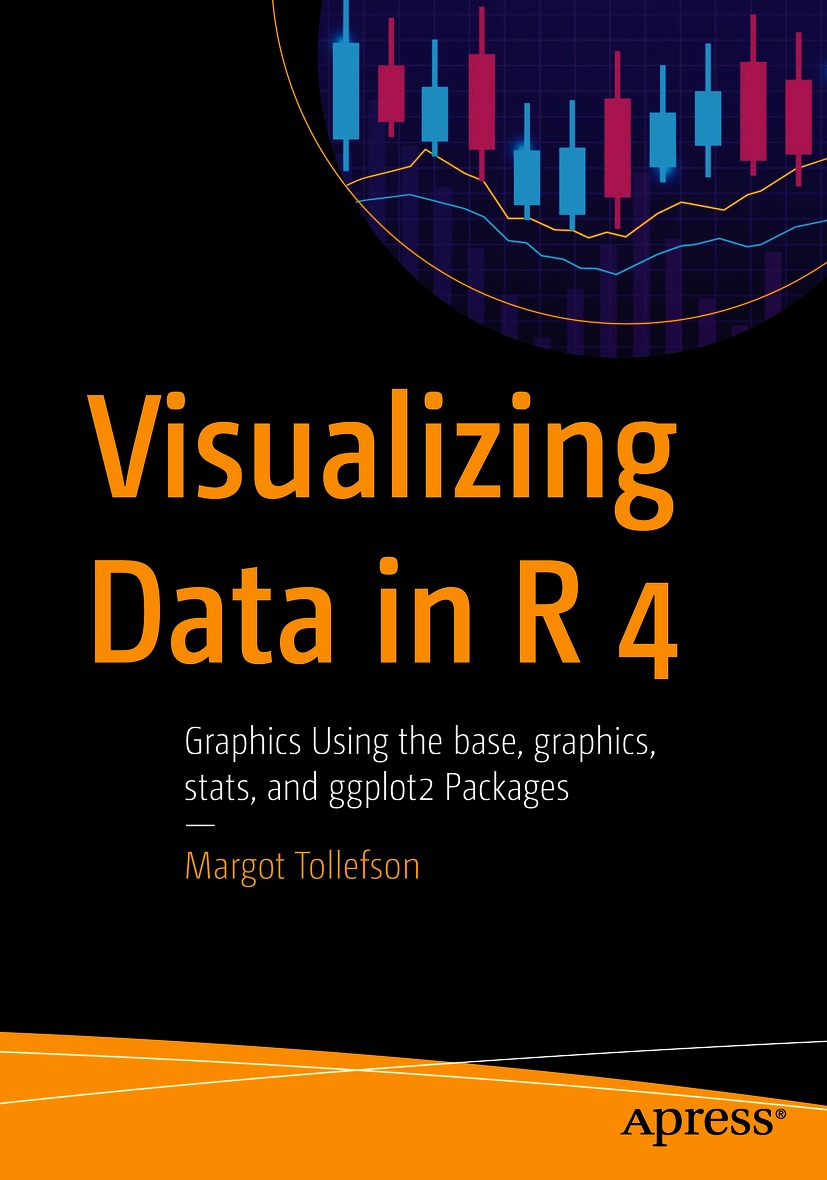
Visualizing Data in R 4 Graphics Using the base graphics stats and ggplot2 Packages 1st Edition by Margot Tollefson ISBN 9781484268308 148426830X
$50.00 Original price was: $50.00.$25.00Current price is: $25.00.
Visualizing Data in R 4 Graphics Using the base graphics stats and ggplot2 Packages 1st Edition by Margot Tollefson – Ebook PDF Instant Download/Delivery: 9781484268308 ,148426830X
Full download Visualizing Data in R 4 Graphics Using the base graphics stats and ggplot2 Packages 1st Edition after payment

Product details:
ISBN 10: 148426830X
ISBN 13: 9781484268308
Author: Margot Tollefson
Visualizing Data in R 4 Graphics Using the base graphics stats and ggplot2 Packages 1st Edition Table of contents:
Part I. An Overview of plot()
1. Introduction: plot( ), qplot( ), and ggplot( ), Plus Some
2. The plot( ) Function
3. The Arguments of plot( )
4. Ancillary Functions for plot( )
5. The Methods of plot( )
6. Graphics Devices and Laying Out Plots
Part II. A Look at the ggplot2 Package
7. Graphics with the ggplot2 Package: An Introduction
8. Working with the ggplot( ) Function: The Theme and the Aesthetics
9. The Geometry, Statistic, Annotation, and borders( ) Functions
10. Formatting and Plot Management Tools
Part III. Appendixes
Plots for Contingency Tables and Discrete Data
Plots for Continuous Variables
Functions That Plot Multiple Plots
Smoothers
Plots for Time Series
Miscellaneous Plotting Functions
People also search for Visualizing Data in R 4 Graphics Using the base graphics stats and ggplot2 Packages 1st Edition:
uses of data visualization
visualizing data in r
visualizing large data sets in r
visualizations in r
use of data visualization tools
Tags:
Margot Tollefson,Visualizing Data,R 4,ggplot2 Packages
You may also like…
Reference - Encyclopaedias
Encyclopedia of Computer Graphics and Games 1st Edition by Newton Lee ISBN 9783031231599 3031231597
Politics & Philosophy - Anthropology
Computers - Computer Graphics & Design
Introduction to Computer Graphics: Using OpenGL and Java, 3rd Edition Karsten Lehn
Computers - Computer Science
Education Studies & Teaching - Studying & Test Preparation
Computers - Programming
Computers - Programming


